Solder Paste Jetting: A Broadband Solution
A series of DoEs show the effects different solders, pump designs, and process parameters have on process robustness.
A typical surface mount process consists of three major process steps: solder paste deposition, pick-and-place and reflow. Solder paste deposition can be performed by two different methods: printing or dispensing/jetting. Printing is the method of choice when possible, due to its higher throughput rate. Dispensing is used only when a small number of components are present on a printed circuit board, or when printing is not possible due to board design complexity.
Recent product miniaturization breakthroughs have pushed stencil printing solder paste to its current process limits. Many handheld devices such as cellphone boards contain miniature devices such as 01005 passives to 0.4mm pitch packages, along with RF shields and large connectors. In addition to components of mixed size, board designers have increased complexity by moving some components below the board level (thus forming a cavity) to increase device functionality without increasing size. As it can be seen in Figure 1, the solder paste volume requirement for the RF shield would be vastly higher than a 01005 passive or 0.4mm pitch CSP.
Many different approaches can be taken to address this issue. They include step stencil, multiple printing passes, and an augmented stencil printing process, such as a combination of printing and dispensing/jetting. In the last approach, augmented stencil printing, a single thickness stencil can be used to provide solder paste requirements for the majority of the components, followed by:
- Dispensing more paste for the RF shield, connector, etc. when a thinner stencil is used, or
- Dispensing paste for smaller components when a thicker stencil is used.
The current study takes a step approach to understand the challenges associated with noncontact dispensing, better known as jetting, associated with both large-volume jetting and ultra-fine dot jetting. Results from the Phase I work are presented.
Solder paste for jetting. Successful solder paste jetting depends highly on paste design and dispenser system design. Solder paste is a critical part of any surface mount process, whether stencil printing or dispensing. As the solder paste printing process is nearly 50-years-old, paste manufacturers have had ample time to optimize paste for printing. However, solder paste jetting is a relatively new process that needs a customized formulation to achieve a robust jetting process.
Key solder paste components important for jetting include:
- Solder powder size.
- Metal content.
- Viscosity.
- Thixotropic properties (the property of fluids that are thick [viscous] under normal conditions, but flow [less viscous] under applied stress).
- Flux type.
- Flux activation temperature.
- Reflow environment.
Among the listed parameters, solder powder size, metal content, viscosity and thixotropic properties are considered most critical for paste jetting. Per Ludwig et al, “The desired solder paste properties include fine solder powder, low viscosity, low metal content, high flux activation temperature, and a high thixotropic index.”2 This work investigates both printing and dispensing of commercially available solder paste to characterize dispensing quality.
Experimental
A two-part approach was taken for the current study. Part one focused on a screening design of experiment (DoE) to determine key dispensing characteristics using a low-metal-content printing solder paste. The second part focused on evaluating commercially available jettable paste using results from part one.
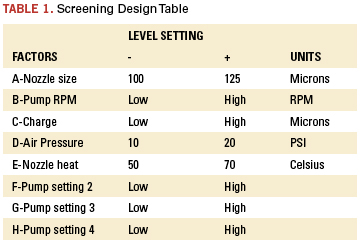
Screening DoE. The screening DoE included eight dispensing system-related factors with one type of solder paste. The paste used was no-clean SAC 305, type IV with 82% metal loading. The dispenser was a Camalot FX-D with SST-500 pump. Table 1 shows design factors and level setting.
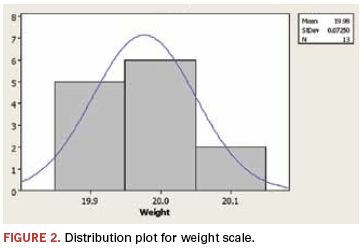
Gage repeatability test. Prior to running the DoE, a gage repeatability test was conducted on the on-board weight scale to ensure the weight scale was capable of detecting the weight variation due to factors manipulation. A total of 20mg of paste was dispensed into the weight cup 13 times to compute P/T ratio (precision-to-tolerance ratio) for the weight scale. The distribution curve for the gage repeatability data is shown in Figure 2, and the P/T ratio is shown below.
The P/T ratio for the weight scale is calculated with a specification limit of +10% of the target of 20mg. The equation and the value for P/T ratio is shown in Eq. 1.
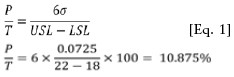
P/T ratio for a target weight of 7.5mg with the same +10% tolerance was calculated to be 30%. Based on the P/T ratio of 10% < P/T < 30%, the weight scale was considered capable.
Methodology. The SST-500 pump was set up according to the manufacturer’s recommended method. The material was purged, and the pump was primed to ensure the system was free of air bubbles and had reached steady-state streaming. After reaching steady state, two types of tests were conducted per run order:
- Predetermined amount of paste was dispensed into the weight cup to determine weight repeatability. Ten replicates per run order were conducted for this phase.
- Following the weight repeatability test, 10 x 10 array of dots and lines were dispensed on a clean board to evaluate the dot size and quality.
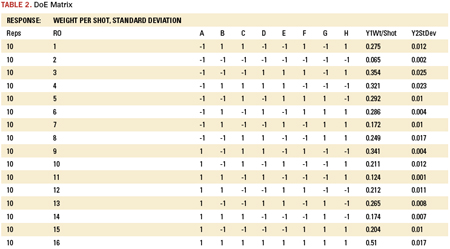
The standard order DoE matrix with the run order is shown in Table 2.
Results and Analysis
The results presented here consider both the mean of 10 replicates and standard deviation as the response variables.
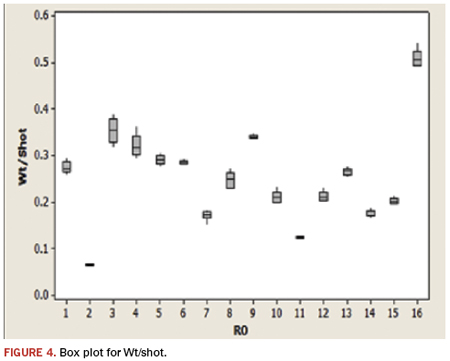
Minitab was the primary statistical analysis tool used for the DoE analysis. The concept of “practical,” “graphical” and “quantitative” analytical approach was taken in analyzing the DoE data. Two major practical analytical methods are highly useful in determining data integrity and high level factor effect: 1. ANOG (Analysis of Goods), and 2. Box plot (and/or run chart). ANOG analysis provides a high-level view of the factor significance and presence of bias in the data, while box plot gives insight to the range and standard deviation of the response variable. Figures 3 and 4 show the ANOG table and box plot for the 16-run DoE. Figure 3 shows spread of response to be between 0.065 to 0.51mg/shot. This indicates that the chosen factors and level settings had a significant effect on the weight/shot response variable. In other words, appropriate factors and level settings were chosen for the DoE. We also see from Figure 3 that several factors (C, D and F) seem to have significant effect on the response. This is indicated by a group of more than 3 “+” or “–” level in the factor column. The box plot, Figure 4, shows the factors and level settings had a significant effect on the response by the random variation of the response. No bias is detected in the response. Based on this analysis, graphical and quantitative analyses were carried out to learn the statistical significance of the factors. 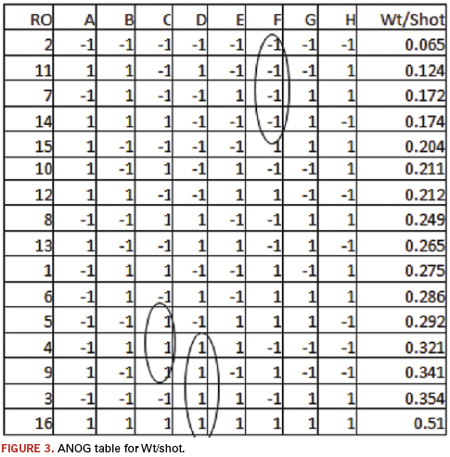
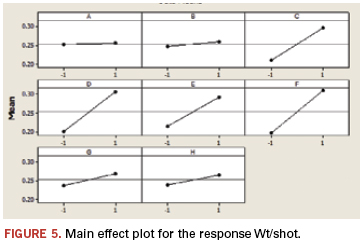
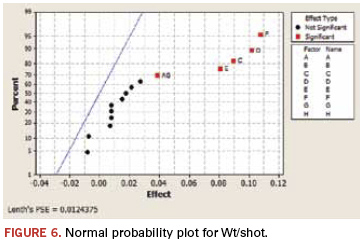
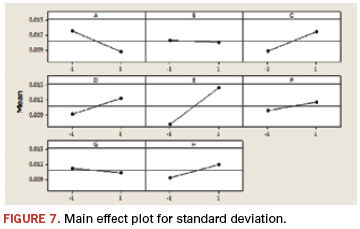
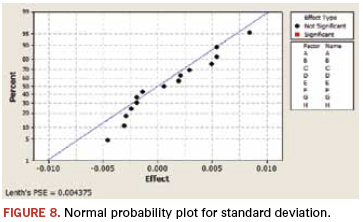
The main effect plot and normal probability plot for both weight/shot and standard deviation are presented in Figures 5 to 8. Four factors (Charge-C, Air pressure-D, Nozzle heat-E and Pump setting 2-F) along with AB interaction statistically, significantly affect the response. When the normal probability plot, Figure 8, for standard deviation is examined, we see none of the factors had significant effect on the weight/shot response. This indicates the experiment was stable, with small standard deviation.
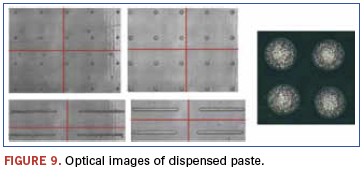
Typical optical images from the experiment are shown in Figure 9. Depending on the factor combination, dot weight ranged from 0.06 to 0.3mg and size ranged from 0.5 to 1mm. Based on the results, several additional DoEs were performed to further understand the effect of critical factors, along with long-term (minimum of one-shift working time) jetting effect.
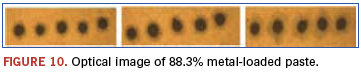
Long-term testing. After two additional DoEs, long-term testing was conducted using a commercially available Type 4 paste with 88% metal loading (printing paste). An automated test was set up to run for 15 hours by dispensing a predetermined pattern onto the weight cup, followed by dot dispensing on a clean board. Figure 10 shows test results. It is clear from the optical images that the dot formation was not as well-formed as with a lower viscosity (low metal loading) paste. Even though the dot quality was less than desirable, it remained consistent throughout the test period. No clogging of the nozzle or pump was observed.
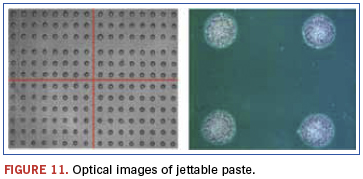
Jettable paste trial. Comparison of jettable paste with standard printing/dispensing paste was conducted using a commercially available paste, design for jetting. Based on the DoE result, an optimum process setup was used for this test. Figure 11 shows the dot quality and size.
Conclusions
A systematic approach to conducting an experiment and analyzing data from solder paste jetting is presented. The results show, depending on the jetting system, only a few factors are critical to the jetting process. These factors will vary from jetting system to system. Based on the experimental data, we make the following conclusions:
- Solder paste type is critical in the success of jetting process. It is feasible to jet high metal loading paste (printing paste type), but the dot/line quality is not acceptable.
- Given the properly designed paste for jetting, it is feasible to deposit 0.5mm dot/line for broadband application.
Additional work is underway to understand the feasibility of jetting solder paste for ultra fine pitch component assembly. Collaboration between material suppliers and equipment vendors is critical to the success of this process development.
Acknowledgments
The author would like to acknowledge Rajiv Iyer and Tom Marjanski, Speedline Technologies, for their invaluable support in providing process knowledge and conducting all the experiments.
References
1. s1.zetaboards.com/Turk/topic/4301811/1/
2. Dr. Richard Ludwig, Dr. Ning-Cheng Lee, Steven Rocco Marongelli, Sergio Porcari, and Sunil Chhabra, “Achieving Ultra-Fine Dot Solder Paste Dispensing,” Proceedings of Advanced Electronic Assembly Conference, October 1988.
Ed.: This article was first published at SMTA International in October 2011 and is reprinted here with permission of the author.
Rita Mohanty, Ph.D., is director, Advanced Development & Application Engineering-Dispenser, at Speedline Technologies (speedlinetech.com); rmohanty@speedlinetech.com.


