PCB Industry Off to Improved Start in 2016
SURREY, ENGLAND -- The printed circuit board industry is rebounding in the first half of 2016, although not every end-market is benefiting, according to a new industry survey.
Automotive, aerospace and medical/industrial are the bright spots, BPA Consulting says, based on data the research group collected.
Movever, BPA adds, the brighter outlook is "not shared" by equipment and consumables suppliers to the PCB industry. "The prognosis here is a flat first half of 2016 and in fact, this is the feeling for 2016 as a whole," BPA said.
Certain market sectors are doing better than others, BPA added, specifically:
- Consumer – Falling levels of demand.
- Automotive – Healthy demand and a bright spot supported by new applications.
- High-speed equipment – Steady demand.
- Computers – Flat or decline.
- Medical and industrial – Steady demand growth.
- Handsets – Flat.
- Military – Flat.
- Aerospace – Steady demand.
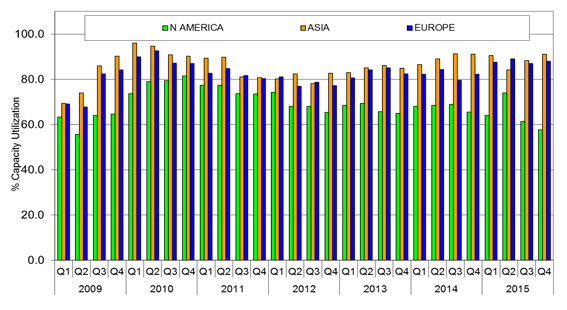
FIGURE 1. Capacity utilization for PCB and flex circuit fabricators by quarter, and is one of the key performance indicators (KPI) BPA uses in its analysis.
FIGURES 2 and 3 shows BPA’s analysis of the trends for semiconductors. Note that these charts show the rate of change of growth. Thus, below 0% is a market contraction and above, is a market expansion. The curve shows a slow-down from the end of 2014 into 2015. Figure 2 below illustrates all four regions, with the black line showing the aggregated world situation. SIA predicts modest semiconductor market growth for 2016.
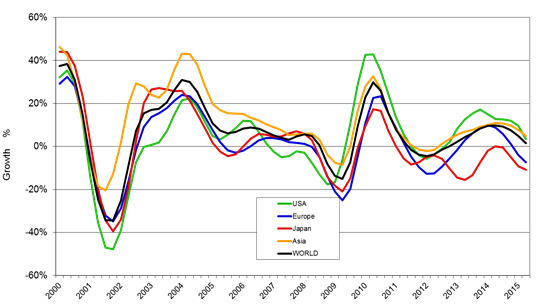
FIGURE 2. Semiconductor growth rates, 2000-2105.
FIGURE 3 on the other hand, is BPA’s forecast. The forecast is suggesting that 2016 will see a single figure contraction (in semiconductor value terms) for shipments compared to 2015. With the macro economic factors as they are at the time of writing, the analysis would to conclude that 2016 is going to be a flat year. The less optimistic outcome (supported by the semiconductor forecasts), may well be a contraction of 3 to 5% in 2016 compared to 2015.
However, such an outcome will be contingent upon the macro-economic stimuli particularly from China and the US in 2016. Such as-yet unannounced measures could result in single-digit growth for the PCB laminate and supply industry. The second key point is that the model shows BPA's assumption that the historical demand cycle will be maintained, which forecasts a much stronger period of growth in the later part of 2017.
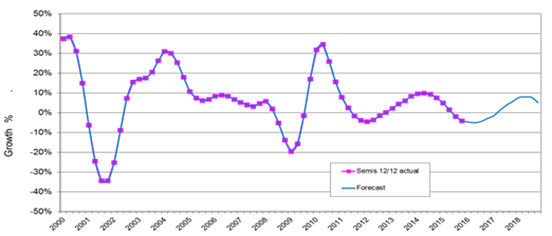
FIGURE 3. World semiconductor growth rates, 2000-2019.


