News
Use of Closed-Loop Process Controls in Dispensing
The side-by-side effects of open- and closed-loop dispensing processes.
Dispensing processes use a variety of technologies. The most common: squeeze bottles and paint brushes. All are simple, handheld devices that allow some measure of control over the placement and amount of fluid deposition. The operator squeezes the bottle or dabs the brush, and an amount of fluid is delivered. “Air-over” syringe dispensers offer more precision. These devices use compressed air to displace the material in a syringe through a dispensing tip or needle. Where larger volumes of material are required, dispensing valves, pumps or guns that use a separate reservoir are employed. These devices operate like a kitchen faucet; when opened, the valve permits the fluid to pass through until shut off. These dispensing technologies are often placed on robotic systems, to increase placement accuracy or throughput rates. Many robotic platforms have closed-loop positional control. However, they lack closed-loop dispensing control. As with any dispensing technology, the amount of material deposited depends on control of the placement as well as the volume of material.
Most dispensing technologies use open-loop controls. That is, no feedback mechanisms confirm that the correct amount of fluid has been deposited. In many dispensing applications, an operator provides the control. However, without some form of feedback, the operator sees no indication of what corrections to make when the material changes viscosity.
Viscosity of the assembly fluid is the leading cause of dispensing inaccuracies. The various methods to measure it differ, and must be selected based upon the information and process control needed. The specification outlined in ASTM standard D 1084-63 (1981) refers to the “Standard Test Methods for Viscosity of Adhesives.” Four methods are described, and four viscosity measurement technologies used. These technologies are:
Method A, Zahn cup (50 ml in 30 to 100 sec. at 23°C).
Method B, Brookfield viscosimeter (used for adhesives with a viscosity of 50 to 200,00 cP, and have approximate Newtonian characteristics).
Method C uses a Stormer viscosimeter (intended as a control method for determining that viscosity of adhesives that have, or approach Newtonian flow characteristics).
Method D is a control method for determining the viscosity of materials that have an equivalent viscosity no greater than approximately 3000 cP, and is limited to materials that have or approach Newtonian flow characteristics.
It could be challenging to use any of these technologies in a production process. Some training and supervision must be given to operators before implementation. In addition, the amount of time to collect data could be too costly for throughput.
Dispensing Test
Two methods of controlling viscosity have emerged in production processes: dot measurement and weight measurement. Weight measurement is the predominant method, and was selected for this test. A dispensing test was devised to closely emulate a production dispensing process. The test was split into two sections:
Section 1: To determine and plot a viscosity curve of a two-part epoxy adhesive.
Section 2: To determine and plot a dispensing process using a non-calibrated dispensing program (constant line speed) and a calibrated dispensing program (variable line speed).
Section 1 required the use of a Brookfield viscosimeter and a computer spreadsheet program. The process for this test is shown in Figure 1. The viscosity test was to substantiate the formulator’s specification for this material. Using the viscosimeter and the accepted test method, we created a graph that showed the material doubled in viscosity, precisely as the formulator specified.
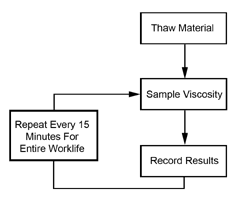 FIGURE 1: Process for viscosity test. |
The process for Section 2 is shown in Figure 2. The dispense test used a tabletop robot with a standard air-over syringe dispensing technology, a balance scale and a computer spreadsheet program. This test was intended to demonstrate the side-by-side effects of an open-loop dispensing process and a closed-loop process, using a dispensing program that had two independent lines. The first line used a set traverse speed, and was unchanged throughout the test, which demonstrated the open-loop process. The second line used a variable traverse speed, and that variation was input to the robot using an offline flow-rate measurement; this line demonstrated the closed-loop process. Both dispense lines used the same dispense tip and air pressure. The process was to dispense a specific amount of the epoxy material, 0.030 grams, onto a glass microscope slide. First, the material was permitted to thaw for 1 hr., then these process steps were repeated every 15 min. for the entire specified worklife of the material. The dispensed slides were then weighed, and the results entered into a spreadsheet.
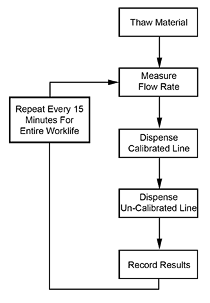 FIGURE 2: Process for dispense test. |
Viscosity Doubled
In the viscosity test, the viscosity of the epoxy doubled within 2 to 4 hrs. from thaw (Figure 3). This result closely followed the formulator’s specification. This point is important and will be used in the development of a control chart.
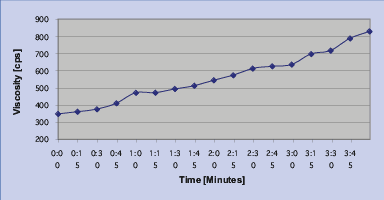 FIGURE 3: Viscosity vs. time. |
In the dispense test, the flow rate of the material through the dispense tip was observed. As expected, the viscosity increased and flow rate decreased (Figure 4). The data show that within the first hour of use, the flow rate decreased by as much as 45% from the initial reading.
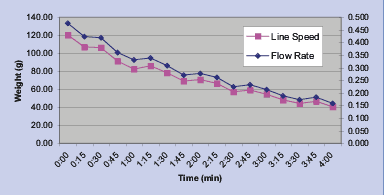 FIGURE 4: Flow rate vs. line speed (calibrated line). |
Related to the flow rate was the line speed of the calibrated dispense, or closed-loop program. A linear relationship was observed between the reduced flow rate and the reduction in line speed. As the flow rate decreased, the dispensing line speed decreased. Also observed was the relationship between viscosity and line speed. The data show that as the viscosity increased, the line speed of the closed-loop program decreased (Figure 5).
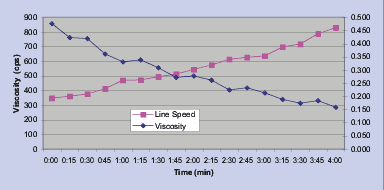 FIGURE 5: Viscosity vs. line speed. |
Finally, the net result demonstrated that without some form of feedback method, or closed-loop, the open-loop dispensing program was dramatically affected by viscosity change. Here, the data show that the target value of 0.030 grams was soon compromised (Figure 6).
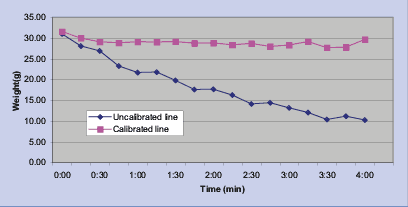 FIGURE 6: Uncalibrated line vs. calibrated line. |
Closed-Loop Feedback Methods
Methods to provide feedback on the dispensing process can be simple or complex, depending upon the controls used. Simple controls are dot gauges and flow gauges. Weight scales or viscosimeters are more costly but provide accurate information and give immediate feedback about the current state of the material viscosity. Automatic controls include weight scales and vision systems incorporated into robotic systems.
Control charts and run charts should be used with any feedback method. Control charts are simple run charts with statistical upper control limits (UCL) and lower control limits (LCL) (Figure 7). The use of these charts enables quick assessment of the state of the process to determine when to take action. The charts also document the process. Control charts are simple to develop. The upper and lower specification limits of the dispensing process are statistically determined, and then placed onto a chart. Using this type of chart and a dot gauge, for example, an operator can take a sample and then log it onto the chart. Once a limit is reached, the operator can take pre-specified actions that will ensure that the dispensed amount remains within a tolerance value.
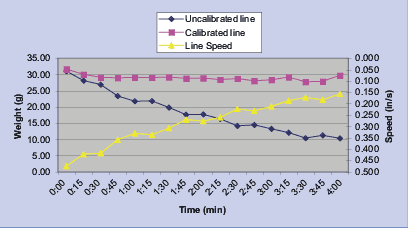 FIGURE 7: Control chart sample. |
Sampling the dispensing process is required to get data, yet taking an excessive number of samples would be cost-prohibitive. The number of samples should be determined statistically, and should not exceed the number of parts being manufactured. The samples taken for this test represented a sample rate of once every 15 min. of production. Once a group of samples are taken, the statistical limits for the process can be set and a corrective action be put into place. In this test, line speed was reduced to dispense the required amount of material within the set tolerances
Dispensing processes that use materials that vary in viscosity require some form of feedback mechanism (either manual or automatic) that ensures the amount being dispensed remains within tolerance limits. This test has demonstrated that with sampling the process at regular intervals, coupled with a corresponding corrective action, this dispensing process was within tolerance limits. Closed-loop dispensing is achievable with even the most simple of dispensing technologies by using some simple feedback methods.
Ed.: This article was first presented at SMTA International in September 2005 and is reprinted here with permission of the author.
Bibliography
A.H. Landrock, “Adhesives Technology Handbook,” Noyas Publications, 1985.
GOAL/QPC, “The Memory Jogger,” 1985.
A. Babiarz, “Adhesive Dispensing,” Surface Mount Technology, June 1992.
Acknowledgments: The author would like to thank Henkel Corp. for its help. Also, thanks to Brad Perkins and Richard Horwath of Asymtek, whose help was invaluable.
James Klocke is business development manager at Asymtek (asymtek.com); jklocke@asymtek.com.


