

Current Issue
How Clean is Clean Enough?
At what level does each of the individual contaminants cause leakage and corrosion failures in SIR?
In this investigation a test matrix was completed utilizing 900 electrodes (small circuit board with parallel copper traces on FR-4 with LPI soldermask at 6, 10 and 50 mil spacing). Twelve ionic contaminants were applied in five concentrations to three different spaced electrodes with five replicas each (three different bare copper trace spacing / five replications of each with five levels of ionic concentration). The investigation was to assess the electrical response under controlled heat and humidity conditions of the known applied contamination to electrodes, using the limits per J-STD-001 for surface insulation resistance, and to determine at what level of contamination and spacing the ionic/organic residue has a failing effect on SIR.
Table 1. Ionic Contamination and Concentration Levels
Using NIST-traceable standards, each individual ionic contaminant was doped on the electrode surface in a specific area, and each was applied with 5µl doses until the total desired concentration was achieved on each sample. Ion chromatography analysis of extracted samples was performed to verify the actual inoculated concentrations prior to SIR testing. Then, each electrode was placed into test chambers and socket tested on electrodes to collect SIR readings every 15 min. with a 5V bias. All samples were exposed to 40°C/90%RH (non-condensing) for 168 hr. with SIR monitoring. After SIR each sample was visually inspected and then extracted and assessed for cleanliness. J-STD-001 SIR limits of values greater than 1.0e8 ohms of resistance or better were used as the pass/fail criteria.
Samples were then compared for ionic cleanliness using ion chromatography.
Following are the ionic contaminants evaluated in this study:
A – Chloride doped on 6, 10 and 50 mil spacing.
B – Bromide doped on 6, 10 and 50 mil spacing.
C – Fluoride doped on 6, 10 and 50 mil spacing.
D – Acetate doped on 6, 10 and 50 mil spacing.
E – Formate doped on 6, 10 and 50 mil spacing.
F – Nitrite doped on 6, 10 and 50 mil spacing.
G – Nitrate doped on 6, 10 and 50 mil spacing.
H – Phosphate doped on 6, 10 and 50 mil spacing.
I – Sulfate doped on 6, 10 and 50 mil spacing.
J – WOA (Succinic Acid) doped on 6, 10 and 50 mil spacing.
K – Sodium doped on 6, 10 and 50 mil spacing.
L – Ammonium doped on 6, 10 and 50 mil spacing.
Sample preparation of electrodes. Sample prep of bare copper trace electrodes used for testing was as follows: Samples were cleaned in an inline cleaner at 1.5 ft./min. belt speed with only deionized (DI) water heated to 150°F, then rinsed in circulated IPA/DI (75%/25%) in ambient conditions for 15 min., then air dried for 30 min. and baked in an oven for an hour at 80°C. Samples were tested prior to doping to verify the electrodes were clean (˂1.0µg/in2 of ionic residue). Each electrode was doped using calibrated, air displacement, pipette volumes of 5µl up to 100 µl, dispensed repetitively in 5µl applications, as required to achieve the proper concentration.
(12) Contaminants x (5) levels of concentration x (5) replications x (3) trace gap spacing test matrix = 900 coupons.
FIGURES 1 to 6 show cross-sectional images of electrodes.
Figure 1. Electrode (6 mil spacing).
Figure 2. Electrode (10 mil spacing).
Figure 3. Electrode (50 mil spacing).
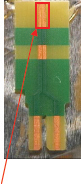
Figure 4. Doping area for 6 mil.
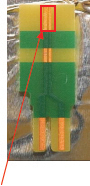
Figure 5. Doping area for 10 mil.
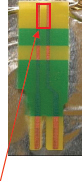
Figure 6. Doping area for 50 mil.
Sample doping procedure (with 5 micro-liter pipette). After samples were doped to the appropriate level and cleanliness analysis was conducted on a subset of samples before testing (FIGURES 7-9), all sample electrodes were randomized in the chamber on 12 socketed assembly boards with 12 sockets per board (FIGURE 10). All samples were processed through the same Thermotron humidity chamber for 168 hr. at 40oC/90%RH in a non-condensing humidity condition over seven weeks. FIGURE 11 shows dendrite growth on electrode.
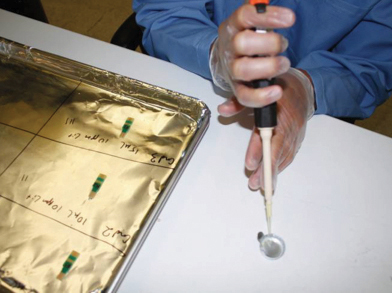
Figure 7. Doping of electrodes.
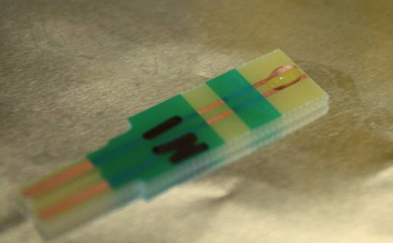
Figure 8. Doped sample prior to drying.
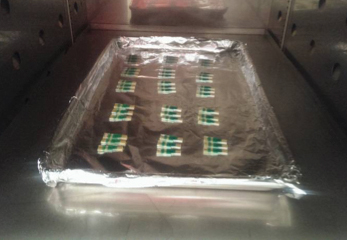
Figure 9. Tray of doped electrodes in oven at 37°C.
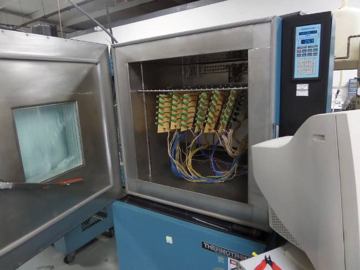
Figure 10. Environmental chamber with socketed boards.
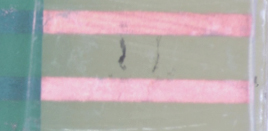
Figure 11. Post SIR chloride sample @5.0µg/in2 showing dendrites.
Chloride contamination. Chloride (Group “A”) ionic species were doped on electrodes with 6, 10 and 50 mil spacing with NIST-traceable standards using 5µl doses in the gap between the parallel bare copper traces. Target levels of contamination are 1, 2, 3, 5, and 10µg/in2 and were achieved by doping the electrode spacing with 5-100 µl of a 10ppm control standard. Group A Chloride findings of contamination levels of 3.0µg/in2 or less have good high SIR values and no signs of electromigration for 6, 10 and 50 mil spacing, while levels of 5µg/in2 and 10µg/in2 show low SIR values and the presence of dendrite shorting, which is considered failing per the IPC criteria, with values less than 1.0e8Ω of resistivity or signs of electrochemical migration debris (FIGURE 12).
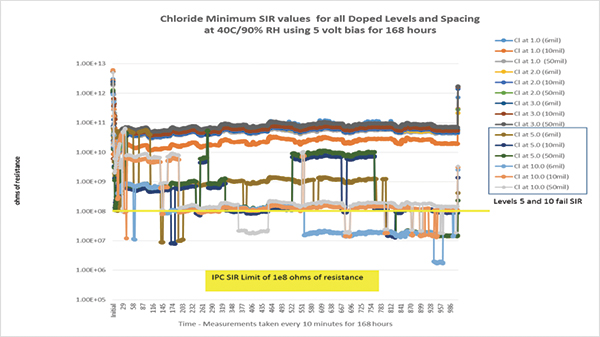
Figure 12. Minimum SIR values of the chloride doped samples.
Table 2. Chloride Levels (Mean Levels of the 5 Replicas)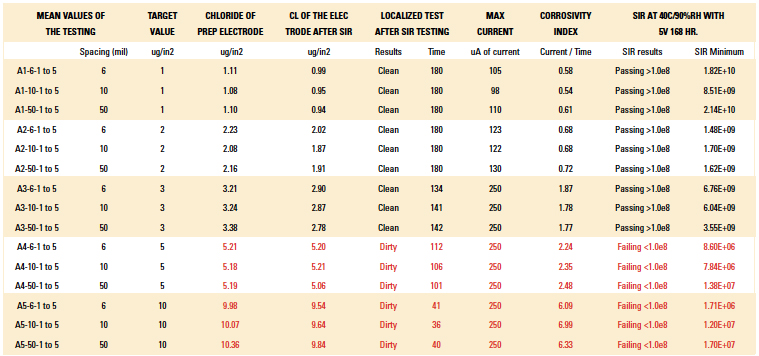
Bromide contamination. Bromide (marked “B”) ionic species were doped on electrodes with 6, 10 and 50 mil spacing with NIST-traceable standards using 5µl doses in the gap between parallel bare copper traces. Target levels of contamination are 1, 3, 6, 12, and 15µg/in2 and were achieved by doping the electrode spacing with 5-100µl of a 10 ppm control standard. Group B Bromide findings of contamination levels of bromide below 7.0µg/in2 or less have good high SIR values and no signs of electromigration for 6, 10 and 50 mil spacing, while levels of 5µg/in2 and 10µg/in2 show low SIR and the presence of dendrite shorting, which is considered failing per the IPC criteria, with values less than 1.0e8 ohms of resistivity or signs of electrochemical migration debris (FIGURE 13).
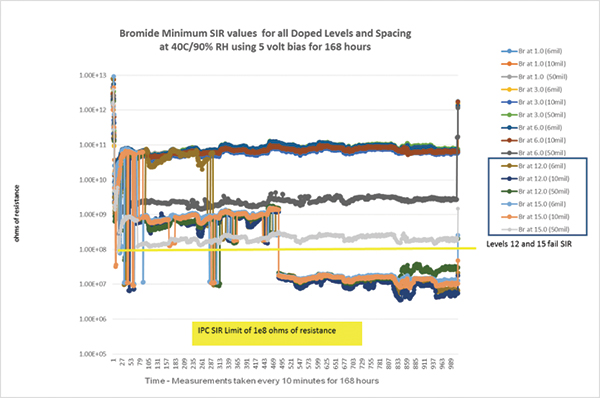
Figure 13. Minimum SIR values of the bromide-doped samples.
Table 3. Bromide Levels (Mean Levels of the 5 Replicas)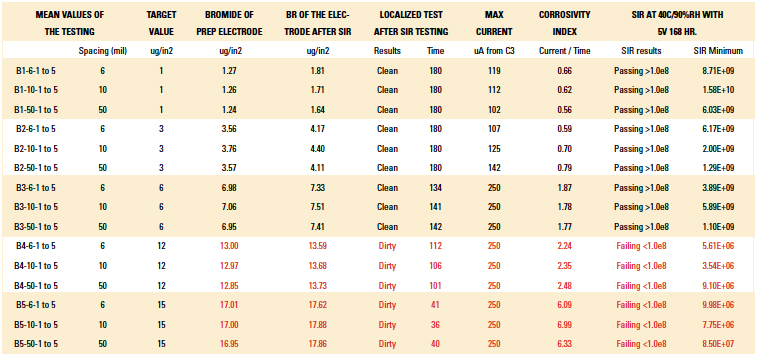
Fluoride contamination. Fluoride (“C”) ionic species were doped on electrodes at 6, 10 and 50 mil spacing from NIST-traceable standards using 5µl doses in the gap between the parallel bare copper traces. Target levels of contamination are 1, 2, 3, 5, and 10µg/in2 and were achieved by doping the electrode spacing with 5-100µl of a 10 ppm control standard. Group C Fluoride findings of contamination levels of fluoride below 3.0µg/in2 or less have good high SIR values and no signs of electromigration for 6, 10 and 50 mil spacing, while levels of 5.0µg/in2 and 10µg/in2 show low SIR and the presence of dendrite shorting, which is considered failing per the IPC criteria, with values less than 1.0e8 ohms of resistivity or signs of electrochemical migration debris (FIGURE 14).
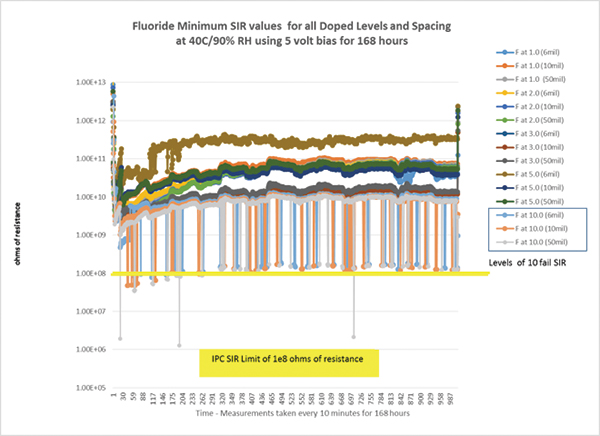
Figure 14. Minimum SIR values of the fluoride doped samples.
Table 4. Fluoride Levels (Mean Levels of the 5 Replicas)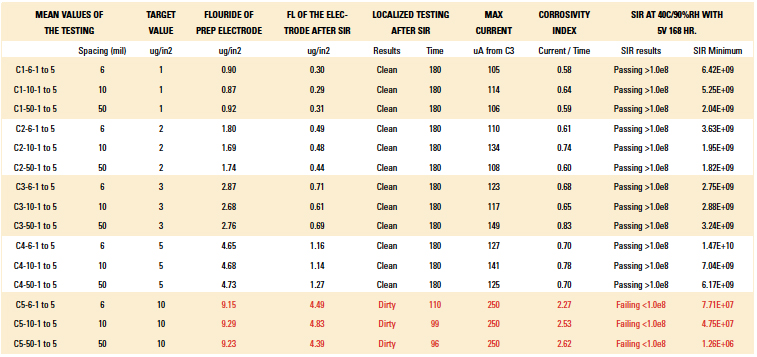
Acetate contamination. Acetate (“D”) ionic species were doped on electrodes at 6, 10 and 50 mil spacing with NIST-traceable standards using µl doses in the gap between the parallel bare copper traces. Target levels of contamination are 1, 3,5, 7, and 10µg/in2 and were achieved by doping the electrode spacing with 5-100µl of a 10 ppm control standard. Group D Acetate findings of contamination levels of acetate below 5.0µg/in2 or less have good high SIR values and no signs of electromigration for 6, 10 and 50 mil spacing, while levels of 7.0µg/in2 and 10µg/in2 show low SIR and the presence of dendrite shorting, which is considered failing per the IPC criteria, with values less than 1.0e8 ohms of resistivity or signs of electrochemical migration debris (FIGURE 15).
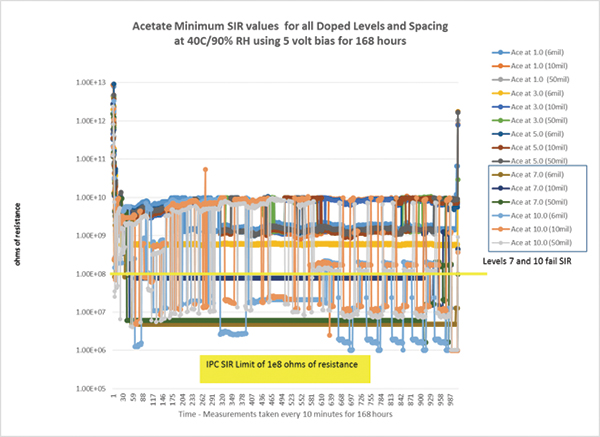
Figure 15a. Minimum SIR values of the acetate doped samples.
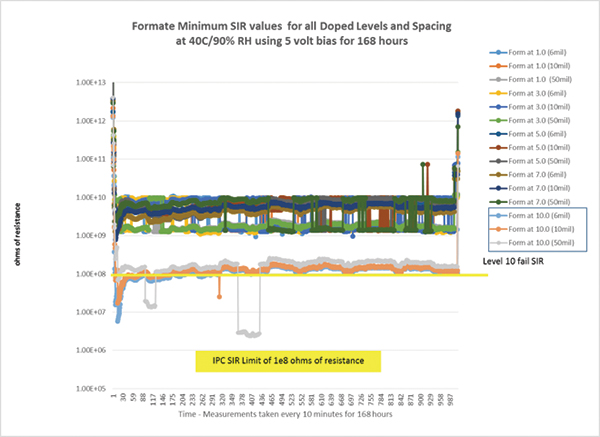
Figure 15b. Minimum SIR values of the formate doped samples.
Table 5. Acetate Levels (Mean Levels of the 5 Replicas)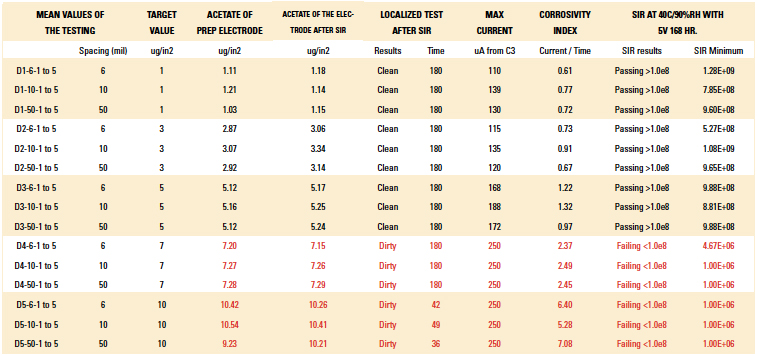
Formate contamination. Formate (“E”) ionic species were doped on electrodes at 6, 10 and 50 mil spacing from NIST-traceable standards using 5µl doses in the gap between the parallel bare copper traces. Target levels of contamination are 1, 3, 5, 7, and 10µg/in2 and were achieved by doping the electrode spacing with 5-100µl of a 10 ppm control standard. Group E Formate findings of contamination levels of formate below 7.0µg/in2 or less have good high SIR values and no signs of electromigration for 6, 10 and 50 mil spacing, while levels of 10µg/in2 show low SIR and the presence of dendrite shorting, which is considered failing per the IPC criteria, with values less than 1.0e8 ohms of resistivity or signs of electrochemical migration debris (FIGURE 16).
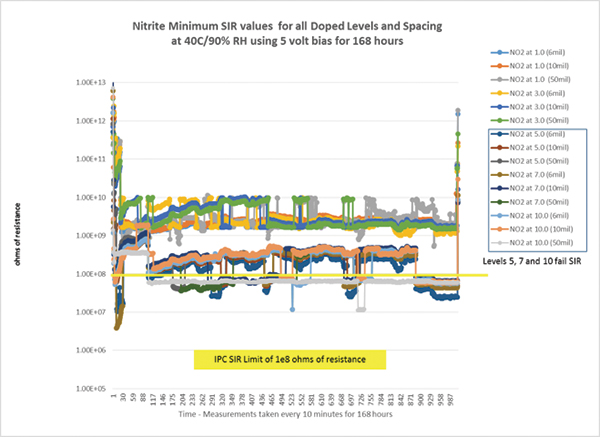
Figure 16. Minimum SIR values of the nitrite doped samples.
Table 6. Formate Levels (Mean Levels of the 5 Replicas)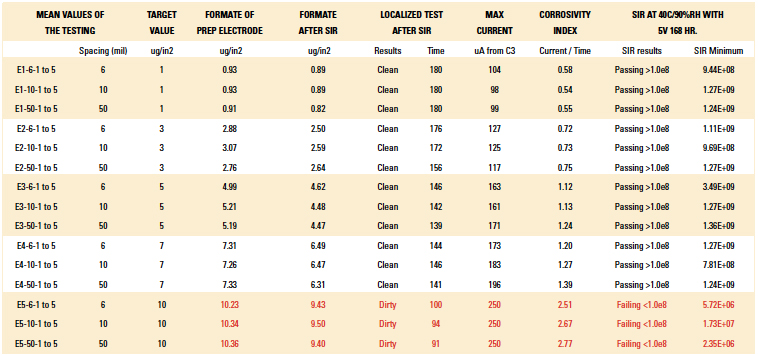
Nitrite contamination. Nitrite (“F”) ionic species were doped on electrodes at 6, 10 and 50 mil spacing from NIST-traceable standards using 5µl doses in the gap between the parallel bare copper traces. Target levels of contamination are 1, 3, 5, 7, and 10µg/in2 and were achieved by doping the electrode spacing with 5-100µl of a 10 ppm control standard. Group F Nitrite findings of contamination levels of nitrite below 3.0µg/in2 or less have good high SIR values and no signs of electromigration for 6, 10 and 50 mil spacing, while levels of 5.0 up to 10µg/in2 show low SIR and the presence of dendrite shorting, which is considered failing per the IPC criteria, with values less than 1.0e8 ohms of resistivity or signs of electrochemical migration debris (FIGURE 16).
Nitrate contamination. Nitrate (“G”) ionic species were doped on electrodes at 6, 10 and 50 mil spacing from NIST-traceable standards using 5µl doses in the gap between the parallel bare copper traces. Target levels of contamination are 1, 3, 5, 7, and 10µg/in2 and were achieved by doping the electrode spacing with 5-100µl of a 10 ppm control standard. Group G Nitrate findings of contamination levels of nitrate below 3.0µg/in2 or less have good high SIR values and no signs of electromigration for 6, 10 and 50 mil spacing, while levels of 5.0 up to 10µg/in2 show low SIR and the presence of dendrite shorting, which is considered failing per the IPC criteria, with values less than 1.0e8 ohms of resistivity or signs of electrochemical migration debris (FIGURE 17).
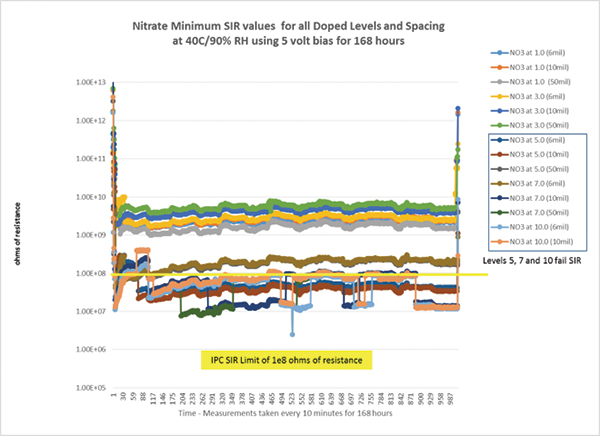
Figure 17. Minimum SIR values of the nitrate doped samples.
Table 7. Nitrite Levels (Mean Levels of the 5 Replicas)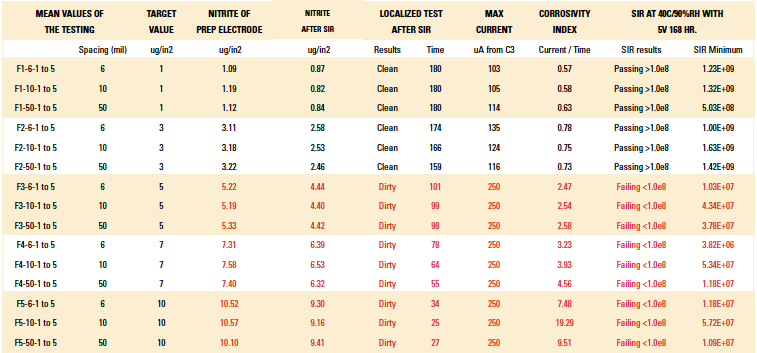
Table 8. Nitrate Levels (Mean Levels of the 5 Replicas)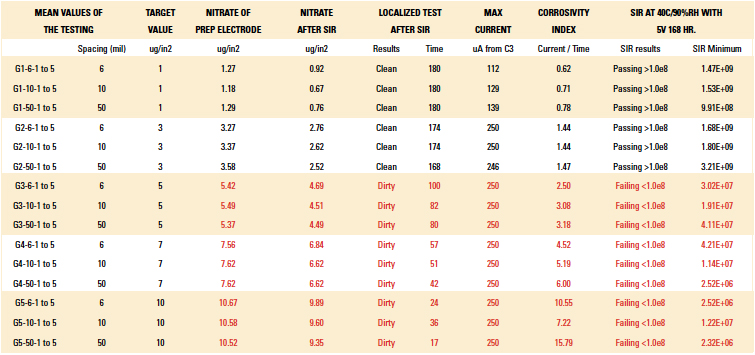
Phosphate contamination. Phosphate (“H”) ionic species were doped on electrodes at 6, 10 and 50 mil spacing with NIST-traceable standards using 5µl doses in the gap between the parallel bare copper traces. Target levels of contamination are 1, 3, 5, 7, and 10µg/in2 and were achieved by doping the electrode spacing with 5-100µl of a 10 ppm control standard. Group H Phosphate findings of contamination levels of phosphate below 3.0µg/in2 or less have good high SIR values and no signs of electromigration for 6, 10 and 50 mil spacing, while levels of 5.0 up to 10µg/in2 show low SIR and the presence of dendrite shorting, which is considered failing per the IPC criteria, with values less than 1.0e8 ohms of resistivity or signs of electrochemical migration debris (FIGURE 18).
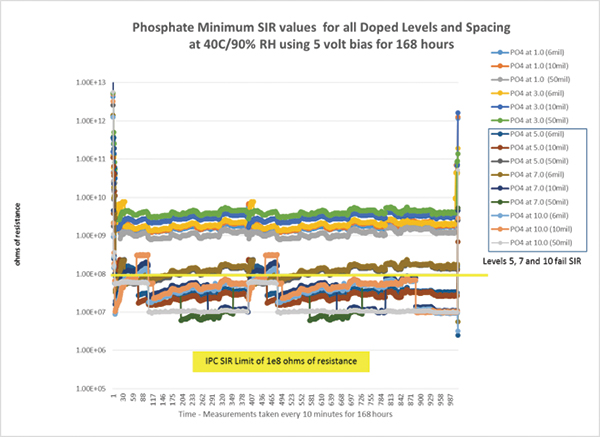
Figure 18. Minimum SIR values of the phosphate doped samples.
Table 9. Phosphate Levels (Mean Levels of the 5 Replicas)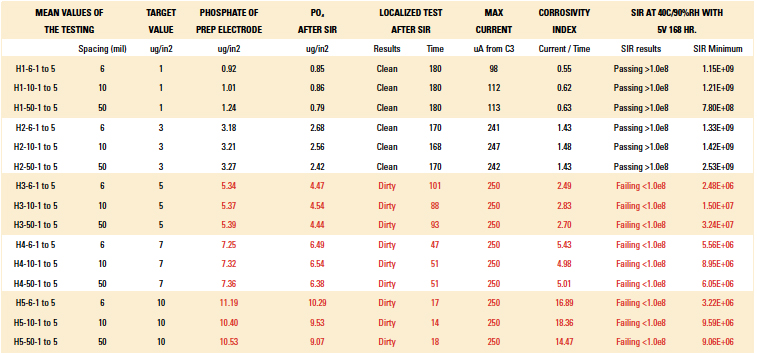
Sulfate contamination. Sulfate (“I”) ionic species were doped on electrodes at 6, 10 and 50 mil spacing with NIST-traceable standards using 5µl doses in the gap between the parallel bare copper traces. Target levels of contamination are 1, 3, 5, 7, and 10µg/in2 and were achieved by doping the electrode spacing with 5-100µl of a 10 ppm control standard. Group I Sulfate findings of contamination levels of sulfate below 3.0µg/in2 or less have good high SIR values and no signs of electromigration for 6, 10 and 50 mil spacing, while levels of 5.0 up to 10µg/in2 show low SIR and the presence of dendrite shorting, which is considered failing per the IPC criteria, with values less than 1.0e8 ohms of resistivity or signs of electrochemical migration debris (FIGURE 19).
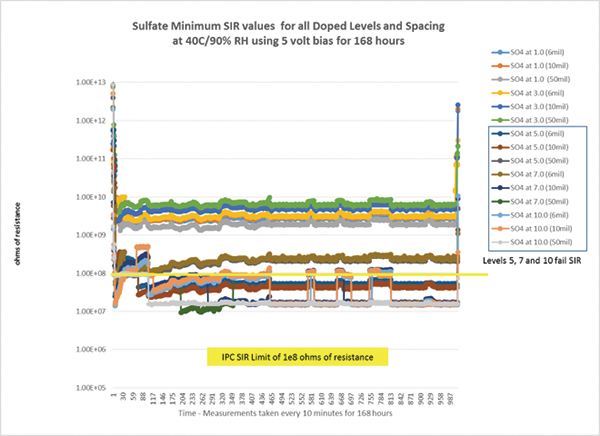
Figure 19. Minimum SIR values of the sulfate doped samples.
Table 10. Sulfate Levels (Mean Levels of the 5 Replicas)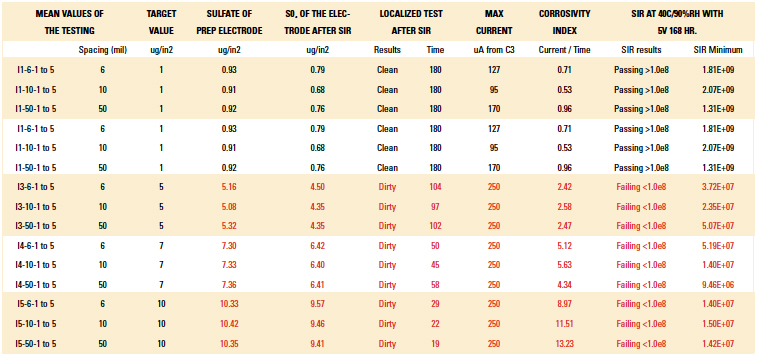
WOA (Succinic acid) contamination. WOA (“J”) ionic species were doped on electrodes at 6, 10 and 50 mil spacing with NIST-traceable standards using 5µl doses in the gap between the parallel bare copper traces. Target levels of contamination are 10, 20, 25, 35, and 50µg/in2 and were achieved by doping the electrode spacing with 5-100µl of a 10 ppm control standard. Group I WOA findings of contamination levels of WOA below 25.0µg/in2 or less have good high SIR values and no signs of electromigration for 6, 10 and 50 mil spacing, while levels of 35.0 up to 50µg/in2 show low SIR and the presence of dendrite shorting, which is considered failing per the IPC criteria, with values less than 1.0e8 ohms of resistivity or signs of electrochemical migration debris (FIGURE 20).
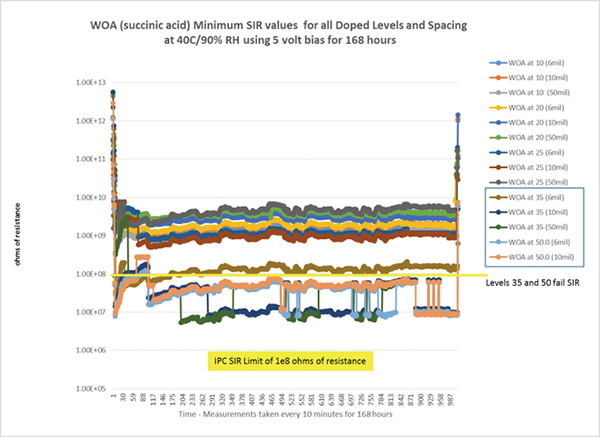
Figure 20. Minimum SIR values of the WOA doped samples.
Table 11. WOA (Succinic Acid) Levels (Mean Levels of the 5 Replicas)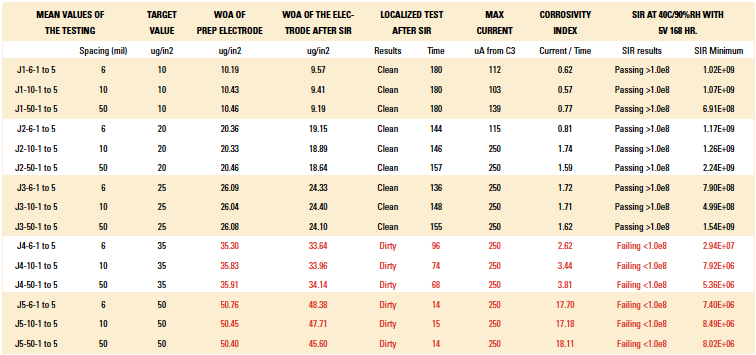
Sodium contamination. Sodium (“K”) ionic species were doped on electrodes at 6, 10 and 50 mil spacing with NIST-traceable standards using 5µl doses in the gap between the parallel bare copper traces. Target levels of contamination are 1, 3, 5, 7, and 10µg/in2 and were achieved by doping the electrode spacing with 5-100µl of a 10 ppm control standard. Group K Sodium findings of contamination levels of sodium below 3.0µg/in2 or less have good high SIR values and no signs of electromigration for 6, 10 and 50 mil spacing, while levels of 5.0 up to 10µg/in2 show low SIR and the presence of dendrite shorting, which is considered failing per the IPC criteria, with values less than 1.0e8 ohms of resistivity or signs of electrochemical migration debris (FIGURE 21).
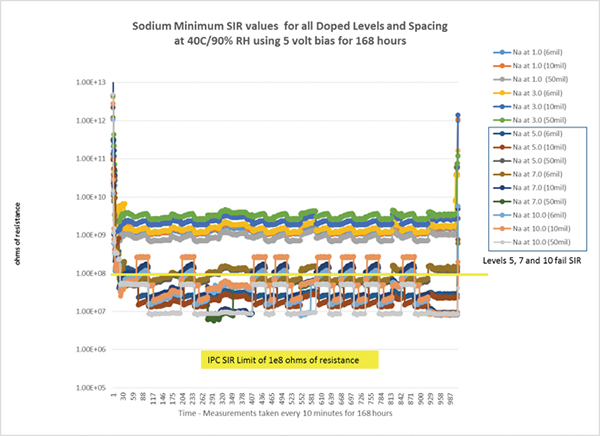
Figure 21. Minimum SIR values of the sodium doped samples.
Table 12. Sodium Levels (Mean Levels of the 5 Replicas)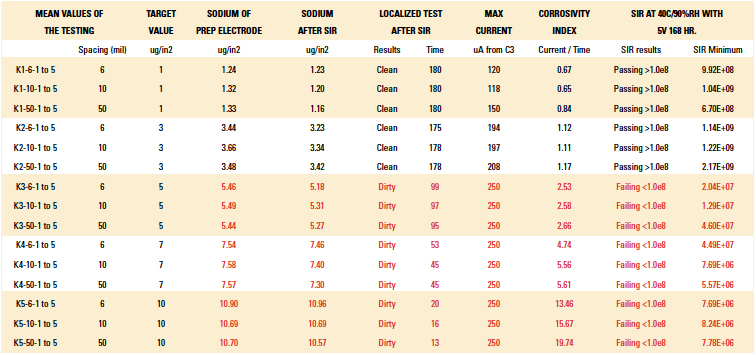
Ammonium contamination. Ammonium (“L”) ionic species were doped on electrodes at 6, 10 and 50 mil spacing with NIST-traceable standards using 5µl doses in the gap between the parallel bare copper traces. Target levels of contamination are 1, 3, 5, 7, and 10µg/in2 and were achieved by doping the electrode spacing with 5-100µl of a 10 ppm control standard. Group I Ammonium findings of contamination levels of sodium below 3.0µg/in2 or less have good high SIR values and no signs of electromigration for 6, 10 and 50 mil spacing, while levels of 5.0 up to 10µg/in2 show low SIR and the presence of dendrite shorting, which is considered failing per the IPC criteria, with values less than 1.0e8 ohms of resistivity or signs of electrochemical migration debris (FIGURE 22).
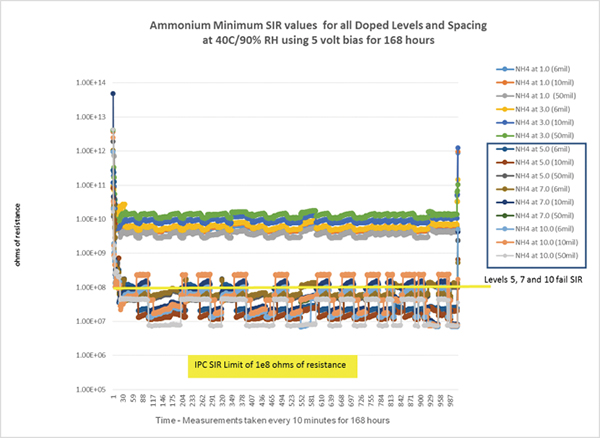
Figure 22. Minimum SIR values of the ammonium doped samples.
Table 13. Ammonium Levels (Mean Levels of the 5 Replicas)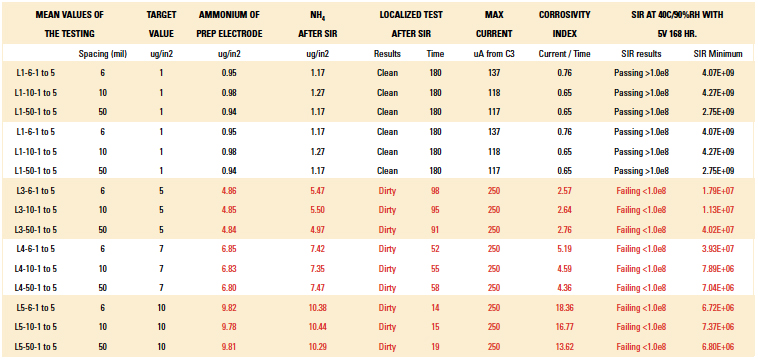
Conclusion
The focus of this research was to determine at what level each ionic contaminant on nominal lead spacing in electronics hardware (IPC Class 2 and Class 3) will cause current leakage and corrosion problems to occur, using the J-STD-001E SIR for pass/fail criteria. This limit has a historical value of SIR for passing above 1.0e8 ohms of resistivity during exposure to SIR humidity conditions of 40oC/90%RH and a 5V bias, monitoring every 10 min. The below levels of contamination correlate to good passing SIR values for each of the individual ionic species:
A – Chloride limit on 6, 10 and 50 mil spacing is 3.0µg/in2 to ensure good electrical performance.
B – Bromide limit on 6, 10 and 50 mil spacing is 7.0µg/in2 to ensure good electrical performance.
C – Fluoride limit on 6, 10 and 50 mil spacing is 3.0µg/in2 to ensure good electrical performance.
D – Acetate limit on 6, 10 and 50 mil spacing is 5.0µg/in2 to ensure good electrical performance.
E – Formate limit on 6, 10 and 50 mil spacing is 7.0µg/in2 to ensure good electrical performance.
F – Nitrite limit on 6, 10 and 50 mil spacing is 3.0µg/in2 to ensure good electrical performance.
G – Nitrate limit on 6, 10 and 50 mil spacing is 3.0µg/in2 to ensure good electrical performance.
H – Phosphate limit on 6, 10 and 50 mil spacing is 3.0µg/in2 to ensure good electrical performance.
I – Sulfate limit on 6, 10 and 50 mil spacing is 3.0µg/in2 to ensure good electrical performance.
J – WOA (Succinic Acid) limit on 6, 10 and 50 mil spacing is 25.0µg/in2 to ensure good electrical performance.
K – Sodium limit on 6, 10 and 50 mil spacing is 3.0µg/in2 to ensure good electrical performance.
L – Ammonium limit on 6, 10 and 50 mil spacing is 3.0µg/in2 to ensure good electrical performance.
As noted, the subject tests showed little difference to spacing of the electrode copper trace spacing during the 168 hr. The results of these tests show a similar concentration failure threshold for each trace spacing of the three tested. Follow-on research is planned to show combined levels of ionic contamination and effects on sensitive active circuitry, such as battery, clock, RF, and high-impedance circuits and SIR at 6 mil spacing.
Ed.: This paper was first presented at IPC Apex and is reprinted here with the author’s permission.
is CEO; is lead investigator; is director of business development; is a former intern at Foresite (foresiteinc.com), and ; terrym@foresiteinc.com.


