

Current Issue
IPC-CC-830B vs. the ‘Real World’
Samples subjected to typical end-use qualification testing revealed the importance of the application technique on the performance of certain coatings.
Assembly process residues or airborne contaminants in the operating environment can lead to metallic dendritic growth, leading to leakage currents that can degrade circuit performance or cause premature circuit assembly failure.1,2,3 Ionic species can react with the circuit board’s metallic surface (under appropriate conditions, usually a monolayer of condensed humidity) to create these leakage currents. Should the contaminants be corrosive under the end-use environment, and the corrosion products be mobile (i.e., soluble in water), they can migrate between traces at different polarities to further degrade performance, until at some point, the corrosion products form a dendrite-like growth of metallic compounds. This can cause an electrical short between the two traces. Often this will lead to catastrophic failure of the device in question.1,2,3 This failure mechanism is known as electrochemical migration (ECM).4 In addition to the short-circuit failure mechanism, there is an open-circuit failure mechanism caused by extensive localized corrosion to a conductive trace.1,2,3
SIR has been demonstrated to be a valuable tool for measuring leakage current between conductive traces1 and forms the basis for most standards relating to the minimum performance of conformal coatings. Materials characterization, process or performance validation by SIR has a long history on flat 2D inter-digitated test coupons, and is the basis for many reliability evaluations and indeed, the basis of many of the international standards, including MIL-I-46058C, IPC-CC-830 and IEC-61086.
The main issue with a flat 2D test coupon is that it does not really model the final product use. Kinner5, Hunt et al.6 and Pauls7 all used variations of the same idea to test material combinations under conditions more similar to real end-use conditions, with various sites designed to trap residues or provide coating coverage challenges. These test boards are now called out in process evaluation methodologies such as IEC-61189-5 and IPC-5704. FIGURE 1 shows the design evolution.
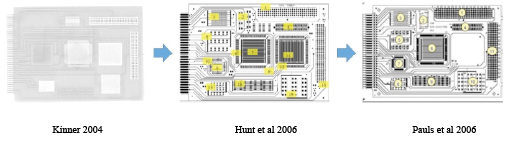
Figure 1. Evolution of IPC-B-52 test coupon.
Conformal coatings are thin polymeric coatings that are applied to all, or particularly sensitive, parts of an assembly, typically by brushing, dipping, spraying, selective spraying/dipping or vapor/plasma deposition. Conformally coated assemblies are often able to survive environments that cause uncoated assemblies to fail.8,9 However, most published work has shown a correlation between conformal coating coverage and the ability to protect circuit assemblies from these harsh environments.1,6,8,9 Essentially the message is, if the coating is not present over metallic surfaces, then it will provide less than optimum protection. In fact, due to localized concentration effects, small voids in the coating coverage may actually increase the degree of corrosion.4,10
Hillman et al11 have undertaken a multi-year, state-of-the-industry review in which multiple IPC-B-52 assemblies using a variety of common conformal coating materials (IPC-CC-830 “qualified”) were coated and cross-sectioned, and normal application methods were used to evaluate the ability of the coating and process to coat the parts uniformly. Results published to date have shown a wide variation in nominal thicknesses and uniformity, with some coatings and application processes providing much better sharp edge coverage than others. The variation in material thickness and lack of edge coverage would be expected to result in reduced protection in harsh environments.
So given that the material performance in end-use environment depends on a combination of the conformal coating material itself and the application process by which it is applied, it seems logical to extend this methodology to conformally coated assemblies. The IPC-B-52 test coupon has been used for evaluating the electrochemical compatibility of typical process materials7, as well as soldering11 and cleanliness assessments/cleaning evaluations.7
However, the components that cause problems for conformal coating are not necessarily the same as those that cause problems for cleaning. In addition, component types, arrays and placement become important factors to the success (or otherwise) of a conformal coating process. To this end, it was decided to design an original test coupon in the style of the IPC-B-52 coupon, but using a variety of components and arrays that might prove more challenging than IPC-B-52 from a coating perspective. The coupons also contained bare 2D SIR patterns found within the international test standards. These assemblies would then be coated with a variety of materials claimed to meet the requirements of IPC-CC-830, using a variety of normal application methods, before being put through a sequential test program. The test program consisted of thermal shock cycles designed to stress the coating, prior to a powered salt-mist test, followed by a long-term steady state humidity test.
New test coupon design. The test board was designed in two double-sided sections, conceived in a similar fashion to the IPC-B-52 board. One side was conceived to be an electrically active SIR coupon similar in design to IPC-B-52 with the inclusion of regular 2D SIR comb patterns taken from IPC-B25A pattern D, IPC-B-24 and IEC-61086 coupons, while the other was intended for visual inspection, mechanical testing and material characterization.
Normally, SIR dummy components are mounted on these types of test assemblies, but to simplify production as much as possible for an end-user, the board was largely designed with component terminations at the same bias and a measurement between the terminations (FIGURE 2). However, since the interest of this work is largely related to the ability of the conformal coatings to prevent ECM, and knowing that ceramic components can be difficult to coat, some of the patterns were laid out with the terminations at a different bias (FIGURE 3).
Figure 2. Component terminations at same bias.
Figure 3. Component terminations at opposite polarity.
Due to the relatively fine pitch of the QFP selected, and given that the interest was primarily in evaluating the coating of the leads themselves, it proved necessary to use a dummy package, with the pads themselves used as the conductive traces, using alternating leads at the same potential (FIGURE 4). The overall board design attempted to group fairly large arrays of discrete components, close to QFP and SOIC devices in arrangements typical of those seen on more problematic assemblies (FIGURE 5). Components were chosen to give higher standoff heights (more of a coating challenge), rather than finer pitch. The bottom side of the mechanical/visual/inspection/characterization coupon is heavily borrowed from a Celestica internal material characterization board, while the SIR board contains a 16-way connector tab, with a common bias distributed to the test patterns by a “zero ohm” bridge, to enable only specific patterns to be tested if required and to prevent excessive bias draw in case of a short developing (FIGURE 6).
Figure 4. QFP leads at alternating polarity.
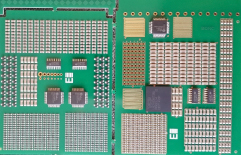
Figure 5. Topside view of new test coupon.
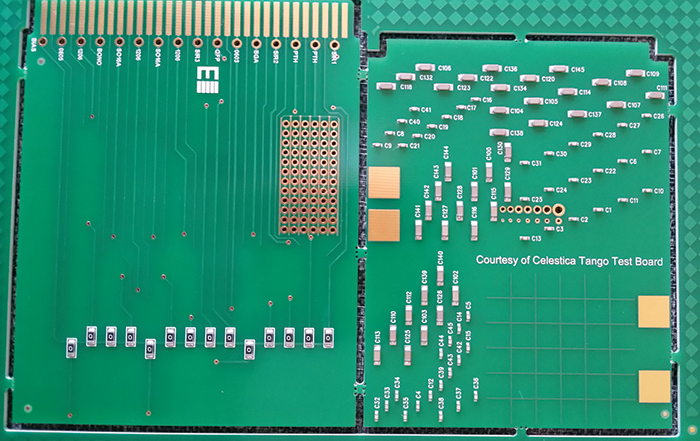
Figure 6. Bottom-side view of new test coupon.
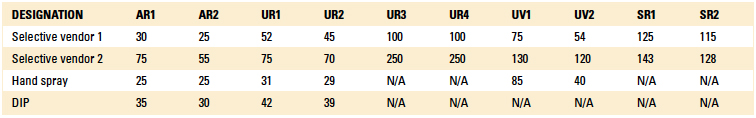
Unfortunately, the through-hole vias on the SIR board intended for axial components to be soldered were not populated by the board assembler. Axial components are among the hardest to coat with conventional liquid conformal coatings and these data would have been valuable. The SIR patterns are summarized in TABLE 1.
Table 1. Summary of SIR Patterns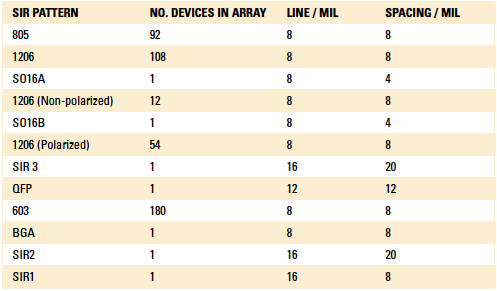
The bare boards were made from FR-4 laminate with 1oz. copper. They were supplied coated with a screen-printed glossy, liquid photoimageable solder mask and developed and cured in accordance with manufacturer’s instructions, including the required pre- and post-bake processes. The boards were then finished with an ENIG solderability finish. The board fabricator was concerned that lead-free HASL couldn’t be guaranteed to be bridge-free, and it had no other finish available.
Boards were assembled using both a water-washable lead-free paste (and cleaned with aqueous saponified cleaning chemistry), and a no-clean paste formulation that has previously been presented as being “compatible” with conformal coating, using the manufacturer’s normal process parameters. Both pastes were SAC 305 alloys.
Conformal coatings selected were applied by a contract conformal coating service using a variety of application methods, including brushing, dipping, manual spray, and selective coating (atomized spray and non-atomized film coating), using the contractor’s normal application and inspection processes. All coated boards were cured in accordance with the manufacturer’s recommendations per the product datasheet, and left for at least 10 days at ambient laboratory conditions prior to testing. Materials selected for the first phase of the study are shown in TABLE 2, along with the nominal thickness of the applied conformal coating measured on the copper test pads using an Eddy Current meter.
Table 2. Conformal Coatings Selected for the Study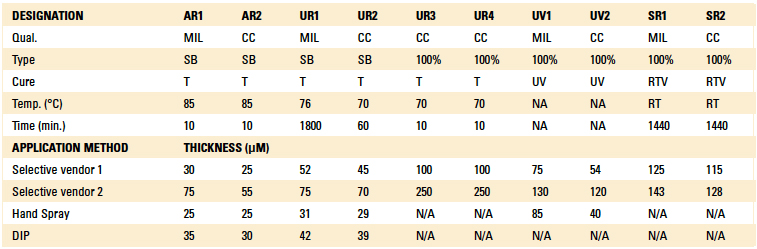
Since the thermal shock test regimen was to be evaluated solely by visual inspection, the interconnects were not soldered until after the conformal coating process and thermal shock cycles had been completed. Per FIGURE 7, 1mm, Teflon-insulated, solid copper wire was hand-soldered to the required test points, using a no-clean, lead-free cored solder wire. A shield was used to prevent flux residue spitting onto the test board. Residues were left uncleaned to minimize potential for damage to the applied coating. To prevent the interconnect solder joints from being the cause of salt-spray failures, the solder joints and zero-Ohm resistors were completely encapsulated with a soft and flexible, hydrophobic polyurethane potting material, known to have good salt-spray resistance. The potting material was cured in accordance with the manufacturer’s recommendations.
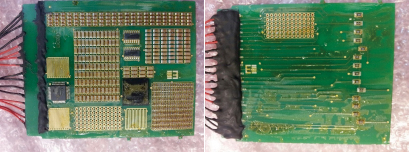
Figure 7. Soldering and potting of interconnects.
Test regimen. Many automotive company specifications for the evaluation of conformal coating require a sequential series of tests to be performed on the test board, whereas most international and industry standards require a new coupon be used for each specified test. This has two main drawbacks:
- The use of a new coupon for each individual test does not fully assess the long-term performance impact of consecutive test regimens upon the material’s protective capability.
- Given the wide range of allowable thicknesses, it would be possible to tailor the applied thickness to suit the required test. It is entirely possible, then, that there is no single thickness at which a material would be capable of passing all the required tests.
It was decided, therefore, to follow the consecutive test-method regimen favored by the automotive industry. The test sequence performed is shown in FIGURE 8.
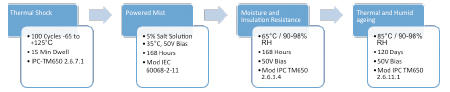
Figure 8. Sequential test regimen.
Experimental
Thermal shock test. Thermal shock testing is intended to fatigue the coating prior to evaluating long-term performance of the conformal coating under rapid transitions in temperature. IPC-TM-650, TM 2.6.7.1 was used for the purpose of this evaluation, although it was extended to 1,000 cycles, typical of automotive applications, and was performed in a newly delivered, factory calibrated ESPEC TSA102-EL chamber. Assemblies were subjected to 1,000 cycles from -65°C (-85°F) to 125°C (257°F), with 15-min. dwells at temperature extremes in accordance with IPC-TM-650, 2.6.7.1. Boards were removed after 100 cycles and then at 250, 500, 750 and 1,000 cycles and visually inspected for cracks, delamination and other deleterious conditions at 10X magnification.
The intention of this test regimen is that, should the coating be unable to resist the required thermal shock cycles without cracking, it would then be more susceptible to corrosion failures during the powered salt-mist testing, with the consecutive powered humid and high-temperature/humid conditions further driving corrosion in susceptible coupons.
Salt-mist testing. This was performed in accordance with IEC 60068-2-11 using 5% NaCl(aq) solution in a calibrated Ascott CC-450 XP chamber. Coupons were mounted in the chamber in vertical orientation to provide some draining, as typically seen in mounted assemblies. In a departure from the IEC test, bias was applied continuously during the test period, which was extended from 96 hr. to 120 hr. The SIR of the test patterns were measured pre-, during (twice daily), and 48 hr. post-test.
Moisture and insulation resistance (MIR). After completion of the salt-spray test protocol, test samples were removed from the Ascott chamber, and the chamber was set to complete five automated clean and purge cycles to remove potential NaCl contamination. The boards were then placed back in the chamber; the drip guard attachment was fitted, and the boards’ SIR measured at ambient laboratory conditions (25°C, 45% RH). The chamber temperature was then raised to 65°C/50% RH and held for a period of 4 hr. to let the chamber and boards equilibrate, prior to raising the humidity to 90-98%. A 50V bias was applied continuously to the boards, and SIR measurements were made twice daily during the 168 hr. duration of the test. At the completion of the test, humidity was reduced to 50%, and then the chamber temperature was slowly reduced to ambient conditions to minimize the chance of condensation. The boards were left a
further two days at ambient conditions, prior to final SIR measurement.
Thermal and humid aging. Once MIR testing was completed, the boards were loaded into an ESPEC Platinous temperature/humidity chamber. The chamber was set to 25°C, 50%RH and stabilized for 4 hr. prior to making the initial SIR measurement. The chamber was then ramped to 85°C and 85%RH. A 50V bias was continually applied; the first MIR measurement was made after one-day stabilization, and measurements were made approximately every two weeks throughout the 120-day test. At the completion of the aging period, the conditions were returned to 25°C/50%RH for two days before the final SIR measurement was made.
Results
Conformal coating application. All the boards were inspected at 4 to 10X magnification under black light (where applicable) prior to test commencement. In general, and as anticipated, more defects were discovered in the selectively coated assemblies, with sharp edge and component lead coverage and capillary flow effects significantly worse than the other application techniques, especially for one of the UV curable coatings, UV1 (FIGURE 9). One of the acrylic materials, AR2, was applied selectively by what was described as a “dry spray process” and was seen to give excellent uniformity, coverage of sharp edges and component leads as shown in (FIGURE 10).
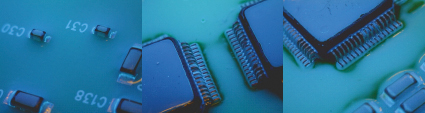
Figure 9. Examples of selectively applied UV1 conformal coating, showing poor edge and lead coverage.
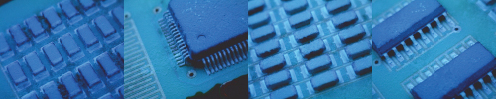
Figure 10. Examples of improved uniformity, sharp edge and lead coverage of AR2 applied by selective “dry-spray” process.
Thermal shock. A total of 1,000 thermal shock cycles was completed. The maintenance team ignored the “leave experiment running” sign, and the first test regimen was stopped after 19 cycles. The boards were removed from the chamber and inspected at 10X magnification for signs of cracking or any other stress-induced defect. Polyurethane coating UR1 showed significant degrees of cracking and delamination after 19 cycles (FIGURE 11). A UV curable conformal coating, UV1, showed signs of delamination from molded component bodies (FIGURE 12).
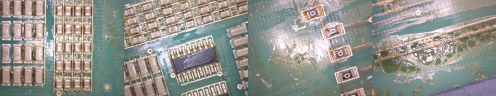
Figure 11. Examples of UR1 cracking and delaminating after 19 thermal shock cycles.
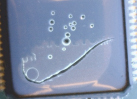
Figure 12. Cracking and delamination of UV1 on component body after 19 thermal shock cycles.
At completion of 100 cycles, UR1 had continued to crack and delaminate, and UV1 showed clear signs of cracking, especially around solder joints. UV1, which was certified to withstand 100 cycles of the same thermal shock conditions on flat FR-4, failed somewhere between 20 and 100 cycles on a more representative test vehicle (FIGURE 13).
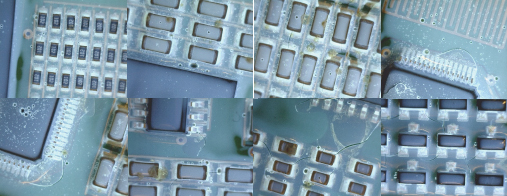
Figure 13. Extensive cracking of UV1 at 100 thermal shock cycles.
By the completion of 750 thermal shock cycles, there were some small cracks evident on UR4 cleaned samples. One board had been supplied with extensive bubbles present, and it appeared cracks were initiating between bubbles (FIGURE 14). It was also noted the coating had significantly darkened during the thermal shock cycles, and the UV tracer no longer functioned. The lack of UV tracer with increased thermal aging was noted across all the urethanes tested in this work. The other test vehicles, without the extensive cracking showed the same darkening, but no crack formation.
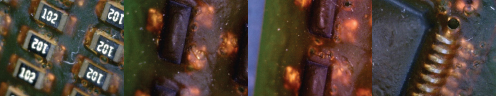
Figure 14. Darkening and crack propagation through adjacent bubbles in UR4 at 750 thermal shock cycles.
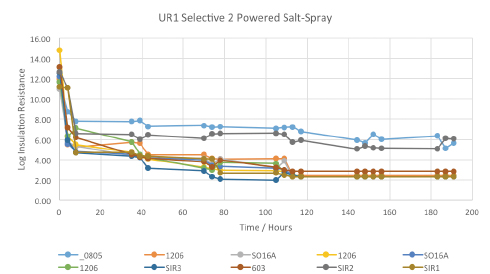
Figure 15. Powered salt-mist data for UR1 selectively coated by vendor 2.
To summarize the data from thermal shock testing, coating/process combinations yielding cracking, delamination and other failure mechanisms within 100 cycles are highlighted in red in TABLE 3. Those combinations producing failures after 100 thermal shock cycles are highlighted in orange. Those combinations that still showed an acceptable result after 750 cycles are shown in green.
Table 3. Summary of Thermal Shock Cycles
Powered salt-mist testing. All the coated test vehicles were subjected to 168 hr. of powered salt-mist testing, using 50V continuous test bias and 5% NaCl (aq) solution. The results are shown below, plotted as the log of insulation resistance against time in hours. UR1 coated test-assemblies were the earliest failures during thermal shock testing and thus were the earliest assemblies to be subjected to the salt-mist test regimen.
The data started at normal, acceptable levels, but dropped very quickly to an unacceptably low level on all the test patterns tested, intuitively suggesting the cracked coating gave little or no protection to the test vehicles during salt-mist testing. At the completion of salt-mist testing, boards were visually inspected at 10X magnification to enable better correlation with the SIR data. Examples are shown in FIGURE 16, but in general, all show significant areas of corrosion product formation. It is worth noting the ENIG would be expected to be more corrosion-resistant than copper, tin or silver finish.
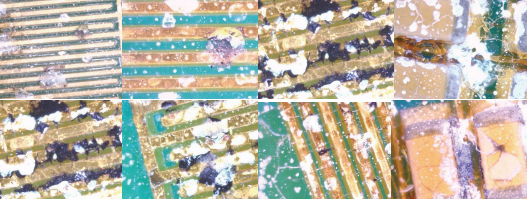
Figure 16. Examples of corrosion seen on UR1 test vehicles after powered salt-mist testing.
UV1 was the next material to show failures during 100 cycles of thermal shock testing, with fairly extensive cracking and delamination seen assembly wide. The results for the selectively coated assemblies from the two different vendors are shown in FIGURE 17. Interestingly, the results show a similar trend, dropping rapidly, remaining remarkably consistent throughout the wet part of the salt-spray test, followed by a partial recovery in SIR of some test sites as the boards were dried out toward the end of the test. However, the vast majority of test sites on both sets of coupons showed very low SIR results.
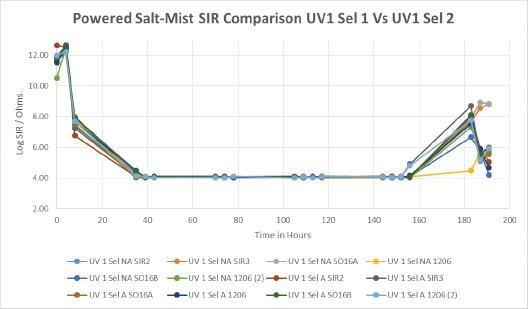
Figure 17. Powered salt-mist data for UV1 selectively coated by vendors 1 and 2.
When comparing the same material applied by two different vendors, AR2 provides an excellent example of the importance of coverage and thickness on the overall protective capability of conformal coatings (FIGURE 18).
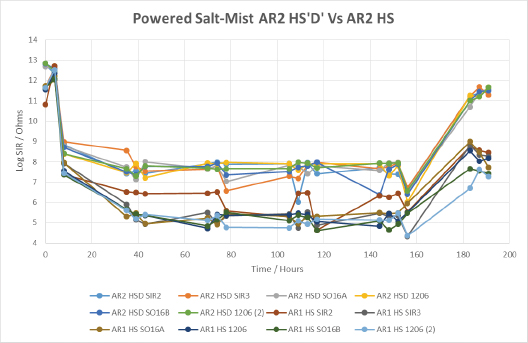
Figure 18. Powered salt-mist data for AR2 coated by “dry-spray” and manual hand spray techniques.
It is clear from looking at the data that the thicker and more uniform coating applied by the dry-spray method shows considerably higher SIR during both the wet-phase and the dry recovery stage than the less-uniform manual spray analog.
When comparing two different silicone coatings, applied by the same selective method, we begin to see the importance of the material’s inherent properties, coupled with the capabilities of the application method (FIGURE 19). SIR values obtained from silicone coating 1 were lower overall than those from silicone coating 2, particularly on the taller components such as the 1206 devices. This is indicative that silicone coating 2 had a greater ability to cover the sharp edges of components when applied by this application method. Overall, the wet SIR values of silicone conformal coating 2 were fairly stable, indicating that material gave a fairly decent level of protection during the salt-spray testing. Both materials showed SIR recovery during the drying out stage, suggesting both materials gave good corrosion protection during wet-powered salt-mist testing.
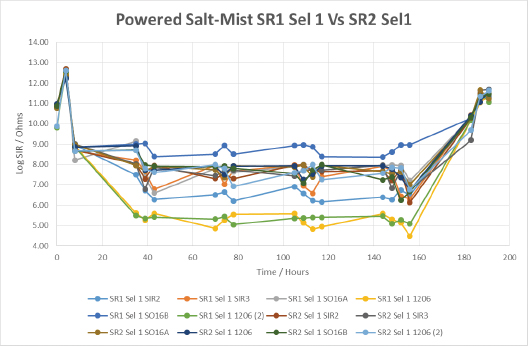
Figure 19. Powered salt-mist data for SR1 and SR2 applied by selective coating technique 1.
FIGURE 20 shows the importance of the application technique on the performance of a urethane conformal coating UR3. Both selective techniques could be described as atomized; however, the atomizing pressure used in AS2 was far greater than in AS1. While this resulted in a more traditional looking, thin coating (100µm), the results show the thicker coating film obtained from AS1 (250µm) led to greater coverage and significantly higher SIR under the wet conditions of the salt-mist test. The SIR values after drying out, referred to as the recovery SIR, were outstanding for UR3, being essentially unchanged from the initial values.
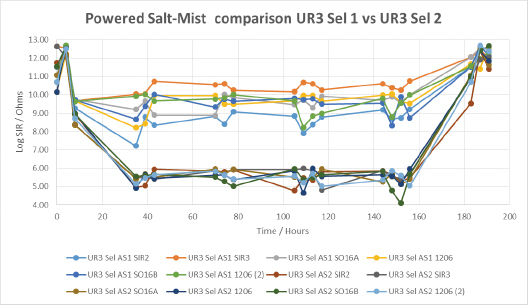
Figure 20. Powered salt-mist data for UR3 applied by different selective coating techniques.
Comparison of conformal coating protective capability and Performance Index. To make it easier to compare the data obtained, a single measure of the protective capability of the coating and process combination was attempted. The data were relatively consistent for each sample set. By combining all measurements made during the wet phase of the salt-mist test and the drying out stage to provide a mean value, and by normalizing the average values relative to the uncoated test vehicle controls, it is possible to produce a comparative performance value during both phases of interest in the powered salt-mist test.
In general terms, of the small number of materials, and the application methods tested to date, it is clear that the protection provided is a combination of the material type, thickness and application method. As expected, the materials that had cracked through to the board prior to the onset of the salt-mist test regimen showed the lowest performance indices.
When the generic material types are looked at, there are basically two groups of results. The urethane materials UR1, UR2, and UV1, along with hand-sprayed AR2, appear in what could be described as a lower performance group. UR3, SR1, SR2 and AR2 “dry” spray applied form a higher performance group.
The clearest illustration of the importance of the application method is shown by the dramatic difference between the dry-spray and traditional hand spray applications of acrylic AR2. There is a similarity between the protective capability of conformal coatings SR1 and SR2, when applied by the same application method. With the exception of the AR2 dry-spray, the materials that performed best in the powered salt-mist were applied considerably more thickly than the materials in the lower performance group. There was a significant difference between the performance of UR3 when applied at around 100µm or at 250µm.
The unexpectedly high performance of the AR2 “dry-spray” process suggests that it is not just the nominal thickness that is important, but the uniformity and completeness of the coverage that is significant in determining the level of protection.
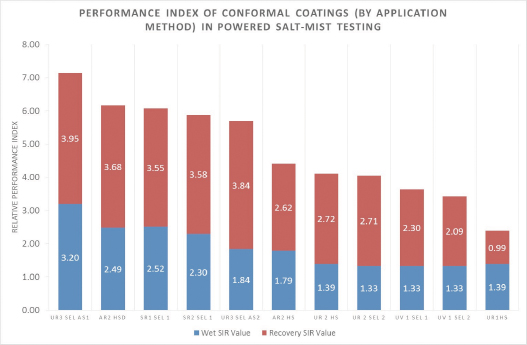
Figure 21. Performance Index of conformal coatings (by application method) in powered salt-mist testing.
Conclusion
IPC-CC-830 is intended to discriminate high-performance materials from materials that provide lower performance. However, all qualification data are produced on flat 2D, FR-4 test coupons finished with bare copper. In addition, IPC-CC-830 limits the applied thickness of types UR and AR to 75µm, whereas silicone materials can be qualified at 200µm. In light of the data shown here, and the move to include ultra-thin coatings in IPC-CC-830C, perhaps the thickness should be left to the manufacturer to determine and should be based on passing the requirements of the specification, rather than an arbitrary number, based on ancient history.
This work shows clearly that the flat, FR-4 test board used for IPC-CC-830 qualification does not adequately stress conformal coatings during thermal shock testing, and that materials meeting the requirements of IPC-CC-830 cannot necessarily be assumed to meet customer expectations in real-life testing on populated assemblies, even when water-washable chemistry is used to eliminate the variable associated with no-clean residues.
Similarly, the current test for flexibility, the 3mm mandrel bend test on an unstressed coating, clearly has little correlation to real-life, given that two materials deemed sufficiently flexible by IPC-CC-830 fail to withstand 100 thermal shock cycles on a populated assembly constructed from materials any coating should reasonably be expected to function with.
Once the conformal coating is cracked, it will provide greatly reduced protection to the assembly against its operating environment. This has been highlighted through the use of a powered salt-spray test, on an admittedly small and incomplete sample set at this time. The ENIG finish is likely to be more corrosion-resistant than other finishes, so it is expected that an alternative finish would yield even more corrosion products.
This work has been a first attempt to combine “process-qualification”-like test methodology with material performance evaluations of conformal coatings and has shown that the methodologies can be used together, but that there are possible refinements to be made on a continuous basis, both to the test vehicle and the evaluation criteria. Based on these results, the conformal coating test coupon must contain materials that the coating should reasonably be expected to adhere to in real world conditions (solder resist, IC packages, metal leads, etc), and contain 3D topography to simulate the effects of CTE and modulus mismatch during thermal excursions. Yes, there are hundreds of possible combinations of variables, but it should prove possible to settle on a standard material set for qualification.
When the test matrix has been completed, it should be possible to make better correlations between application method, coating thickness and performance under more real world conditions.
References
1. Dr. Chris Hunt and Ling Zou, “NPL Report DEPC MPR 054,” July 2006.
2. Luis F. Garfias, Robert P. Frankenthal and J. L. Valdes, “Dendrite Growth in Electronic Materials and Devices: A Perspective and the Electrochemical Mechanism,” 1991.
3. Elissa Bumiller and Dr. Craig Hillman, “A Review of Models for Time-to-Failure Due to Metallic Migration Mechanisms,” DFR Solutions white paper, 2009.
4. Rajendran et al., “Corrosion and Protection of Electronic Components in Different Environmental Conditions – An Overview,” The Open Corrosion Journal, vol. 2, 2009.
5. P. Kinner, “A New, More Representative SIR Test Method is Used to Validate the Reliability of a More Environmentally Acceptable PCB Production Process,” IEEE International Conference on the Business of Electronic Product Liability and Reliability, 2004.
6. Ling Zou and Dr. Christopher Hunt, “Test Method for Conformal Coating Protection Performance of Electronic Assembly in Harsh Environments,” DEPC-MPR 060, March 2007.
7. Doug Pauls, Courteney Slach and Nathan Devore, “Process Qualification using the IPC-B-52 Standard Test Assembly, IPC Apex Proceedings, March 2006.
8. P-E Tegehall, “Evaluation of Conformal Coatings to Prevent Degradation of Printed Circuit Assemblies in Harsh Environments, Part 2,” IVF Research Publication 96807, Swedish Institute of Production Engineering Research, 1996.
9. W.J. Curren, et al, “Performance of Conformal Coatings in Severe Environments,” paper no. 338, Corrosion 87, NACE.
10. McCafferty, Introduction to Corrosion Science, E. Springer, 2010.
11. The IPC-B-52 SIR Test Vehicle: Current Test Vehicle Design and Possible Modifications: Current Designs Fail to Represent Real Product. A List of Suggested Improvements,” The Free Library. (2014). Retrieved Nov 04 2014 from http://www.thefreelibrary.com/The+IPC-B-52+sir+test+vehicle%3a+current+test+vehicle+design+and...-a0331600321
Ed.: This article was first presented at IPC Apex Expo in February 2015 and is reprinted here with permission of the authors.
is development chemist and is global business/technical director, conformal coatings at Electrolube (electrolube.com); phil.kinner@electrolube.com.


