

Pitfalls of EMS Market Analyses in Europe
With so many studies available, which one(s) can you believe? (Not many.)
When meeting with potential customers, never talk about the disadvantages of your competitors; only talk about the advantages of your product. I am not here to sell something. I am here to bring light to the dark, to separate the chaff from the wheat. My talk is straightforward. Some people do not like this. For those people I have advice: stop reading.
I have been conducting market analyses for different parts of the electronics market for the past 19 years, starting with the PCB industry in my function as managing director of the German Association of Printed Circuit Industry, and for member companies of the OEM, EMS and ceramic hybrid industry. Fruitful discussions with industry colleagues were helpful, and my understanding of the principles of market behavior and interpretation of numbers grew every year.
Having experienced how fast markets can move, whether to China or other countries in the Far East, in 2015 I decided to bring my experience to all EMS companies in Europe. My objective was to help the European industry make better decisions in strategic planning, benchmarking and understanding of the European EMS market. This marked the launch of the in4ma (information for manufacturers) EMS statistical program for Europe.
Many others called themselves market researchers, I knew, but over a period of more than 12 years their reports had been discussed inside the association, and the majority were ripped apart as they were not worth the price at which they were sold.
The Global Pitfalls with Currency Conversion
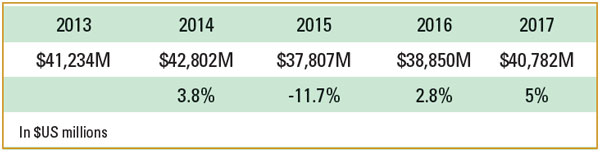
Global market reports typically suffer in that they do not understand the basics of currencies. Last week, for instance, I received a report that showed numbers for multiple regions, including Europe. To compare different global regions, all numbers were given in US dollars. TABLE 1 shows this report’s timeline for EMS in Europe. On a first view, the numbers show no unusual growth rates, and most readers would probably just accept those numbers as accurate.
Table 1. European EMS Revenues from a Global Market Report
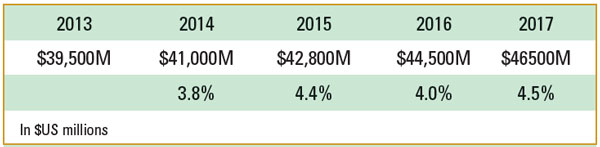
Now, we need to realize Europe does not use the US dollar as legal tender. Of the 38 European countries that have EMS production, 24 use the euro as legal tender, and the others use their own currency, some strongly connected to the euro. When calculating the total European production value, one first must convert the different currencies to a common currency, which is the euro. This means each year one must calculate the average exchange rate for the 14 different currencies to get to a common value in euros.
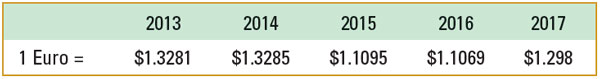
The next step is to convert this euro value into US dollars to make the numbers comparable to the other global regions. Again, first you need the average exchange rates from euro to US dollars. Here they come (TABLE 2).
Table 2. Average Annual Exchange Rates, USD to Euro
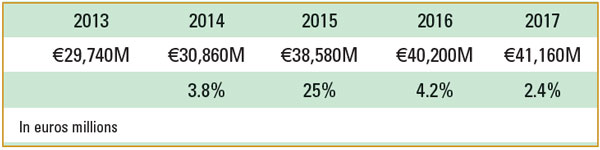
Now we take the numbers in US dollars and convert them into euros. Please realize the numbers in US dollars were converted to make the numbers comparable to other global regions. The reality for Europe is the euro. If you want to judge how Europe developed, you must have the euro numbers. Judging an individual market within Europe requires the appropriate conversion rate into the legal tender of the country in question.
Look closely at TABLE 3. In euros there is a 25% jump in Europe. The market does not jump! In this report, the numbers for Europe never had been collected in the appropriate legal tender and then converted. They were estimated in US dollars, probably in 2013, and then some smart estimation was made to make the numbers look reasonable for the next four years. That the exchange rate to the euro changed dramatically from 2014 to 2015 was ignored. To judge the development of a market, one must look at it in the appropriate legal tender. For comparison, one can then convert the numbers into US dollars.
Table 3. European EMS Revenues from Table 1, Converted with Exchange Rates of Table 2 to USD
Looking at the real numbers for Europe, which can be found on my website (in4ma.de), the picture looks like TABLE 4. The numbers have a last digit because they are the sum of the revenue numbers of the individual countries, and the different countries are the sum of the revenues of the individual companies.
Table 4. The in4ma European EMS Revenues, Real Numbers from Primary Analyses
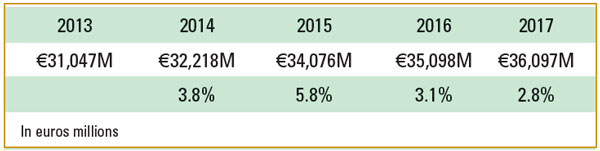
In 2015, the growth rate in euros was 5.8%. When converting the numbers to US dollars using the aforementioned conversion rates, 2015 shows an 11.7% drop (TABLE 5).
Table 5. The in4ma European EMS Revenues of Table 4, Converted with Exchange Rates of Table 2 to US Dollars
Realize this has nothing to do with the actual market. It is simply the byproduct of changes in the conversion rates. One needs brains to do market analysis. Europe is not the United States of Europe. We have many different cultures, many different languages, many different currencies, many different business habits, and every European country is unique.
In summary, in the event I wasn’t clear, the numbers in Tables 1 and 3 were generated by someone who does not understand the financial world of currencies.
Secondary Analysis Pitfalls
Be careful when you read “extensive secondary research was conducted for collection of data required for estimations, as well as forecasting.” This was one of the sentences in the report which did not reflect the currency changes mentioned before. It means it is guesswork, nothing more. Unfortunately, this sums up the majority of market analysis reports.
Papers about the European EMS industry on the market – I refrain from calling them studies on purpose – are obviously so wrong, it is unbelievable how many large European EMS companies use them, even in communications with shareholders.
Just recently, I was confronted again with such a paper. The paper gave detailed information for European countries. I picked the first one: Austria. It gave an EMS value of €486 million in 2017 and forecast an average growth of 3.46% until 2022. Yes, you read correctly: not 3.45% or 3.47%, but exactly 3.46%. For the record, 0.01% equals €48,600. That must be a very precise market analysis.
Now I looked at the in4ma EMS database of 1,835 EMS companies in Europe. I took the eight largest Austrian EMS manufacturers, as shown in TABLE 6. These eight companies have one thing in common. They are called big capital companies (>20 million euros in total assets, >50 million euros in revenues, >250 employees) in accordance with §221 of the UHG (the Austrian trade law) and have to open their books in full in the company registers. The company registers are public (firmenbuchgrundbuch.at); one need pay only a fee to access the annual reports. This is the typical way I do market analyses. I read all reports, and the numbers go into my database. Numbers for the different countries are simple addition.
Table 6. Top 8 EMS Companies in Austria
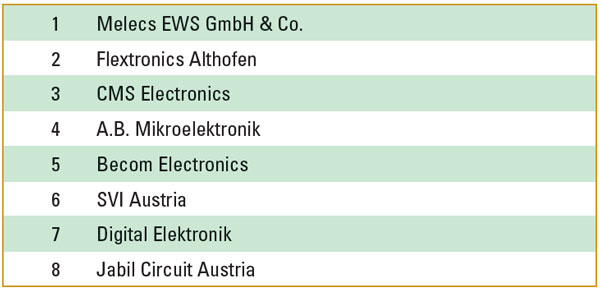
Table 7. Deviation of Fake Numbers to in4ma Primary Analysis
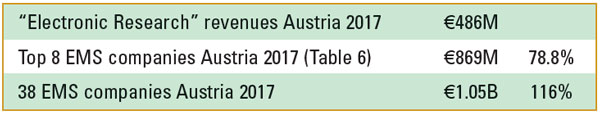
Looking at the revenues of the above eight companies, their revenues totaled €869 million in 2017, which is 78.8% higher than the number of this “analyst.”
Austria has 38 EMS firms, so revenues of 30 more companies need to be added. Now there are ways to get to the revenues of these companies as well, the small ones with a minor inaccuracy, as explained later. Total revenues of these 38 EMS were €1.05 billion in 2017 and €1.11 billion in 2018. The growth rate was 8.5% in 2017 and 5.8% in 2018. The real revenues of Austria’s EMS companies were 116% higher than the “analyst” numbers for 2017.
This comparison can be done for every individual country. The biggest deviations are in Western Europe, but, even in Eastern Europe, on average there is a deviation of 9.9%. How so? Eastern Europe has much fewer EMS companies, but many have large revenues, as they are subsidiaries of global EMS players (Foxconn, Flex, Jabil, PCE Paragon, Wistron, Kimball, and Celestica). In Eastern Europe, 409 companies generated €17.57 billion in revenues, while the 1,426 EMS companies in Western Europe generated €18.55 billion in revenues in 2017. By contrast, this “analyst” reported Western European EMS had revenues of €12.61 billion, and, interestingly, Hungary showed higher EMS revenues than Germany. In reality, revenues at EMS companies in Germany were more than 36% higher than in Hungary in 2017.
Geographical Pitfalls
Although UK-based, the same “analyst” seemingly has a geographical problem. In his charts, Western Europe is separated from “CEE, MENA & other,” and then he adds the two different numbers to calculate “Total Europe.” Whereas in sales organizations it is common practice to combine Europe and MENA (Middle East and North Africa), as the latter is too small to be handled separately, market analyses call for precision. MENA is not part of Europe and therefore should not be added to “Total Europe.”
The same “analyst” combines the numbers for Russia and Ukraine and states the total as €205 million for 2017. Russia invaded Crimea in 2014 and annexed it, but not all Ukraine. The Ukrainian people find it an affront to be aggregated with Russia. Russia has 60 EMS companies, with 2017 revenues of €354 million. This number comes from the Electronics Developers and Manufacturers Association in Moscow. The biggest EMS company in Ukraine alone has higher revenues than stated in the report for Russia and Ukraine together.
NACE Code Pitfalls
Several market research reports base their analyses on NACE (Nomenclature of Economic Activities) codes. NACE is the European statistical classification of economic activities. NACE groups organizations according to their business activities. Statistics produced based on NACE are comparable at the European level and, in general, at the global level are in line with the United Nations’ International Standard Industrial Classification (ISIC). At least this is the theory.
In practical terms, it is not usable for certain analyses such as the EMS market. EMS companies manufacture many different products. They are subcontractors to OEMs. This means OEMs and EMS companies use the same NACE codes. An EMS company primarily manufacturing telecommunication products uses a different NACE code (C26.2.0 manufacture of computers and peripheral equipment) than an EMS company for whose majority of manufacturing is computer equipment (C26.3.0).
In case an EMS company only manufactures PCBAs, the regular NACE code is C26.1.2 (manufacture of loaded electronic boards). In reality, more than 50% of all EMSes doing only PCBA work use the NACE code C26.1.1 (manufacture of electronic components), which is also used, for instance, by PCB manufacturers (FIGURE 1).
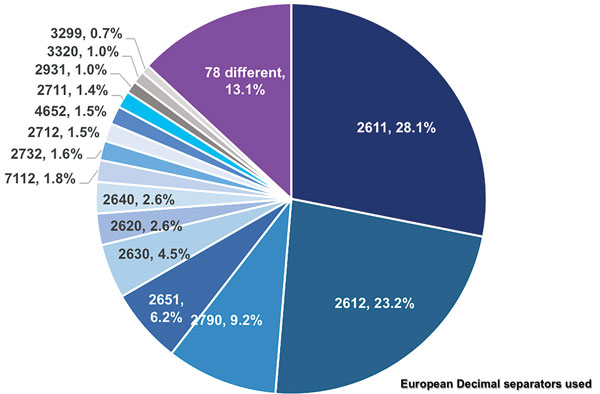
Figure 1. NACE codes used by the EMS industry in Europe, 1,250 of 1,835 EMS companies analyzed.
One might wonder about some of the NACE codes, but the explanation is easy. A company generating revenues with different products and services classifies its revenues by the majority percentage. If a company manufactures loaded electronic boards (C26.1.2) as an EMS service, and this is 50% of revenues, manufactures its own computers (C26.3.0), generating 28% of revenues there, and makes 22% of revenues with installations of machinery (C33.2.0), it will report C26.1.2. If numbers change and installations become the main revenue share, C33.2.0 will be reported. In talking with some EMS companies in Europe that report C26.1.1, they did not know C26.1.2 exists.
The Content Trap
A customer charged more than $5,000 for a market report wants a return. This is why report samples come with long, detailed tables of content and a lengthy list of companies covered. What can you expect? Do you really think you will get confidential information about the listed companies, or is it a summary of what you can read on the corporate websites and in annual reports? In my opinion, it is better to read the original annual report, rather than a summary. But the main objective is to show that for $5,000 you get many pages.
Knowing the pitfalls for good market statistics, I started a primary analysis of the European EMS industry in 2015. The objective was to get to reliable numbers for the European EMS industry, without the EMS companies having to pay thousands of dollars or euros for highly flawed reports. The basis was a list of 1,300 EMS companies I had from my previous work. Over a period of three years, a total of more than 1,800 EMS companies in Europe were identified. For all companies, the country company registers were consulted. Some were free of charge. Others required a fee for every paper filed. In addition, there are databank systems with direct access to the company registers, which make the research a little easier but are very expensive.
In Europe, all large companies must file annual returns with the company registers. Revenues, number of employees and total assets are the criteria establishing whether an entity must file a full profit and loss account, a P&L account that starts with gross profit, or the balance sheet only.
Some 70% of all revenues are taken from the P&L of the company registers. Another 5% are retrieved from the in4ma annual EMS statistics, where more than 125 EMS companies from the Germany/Austria/Switzerland (DACH) region report revenues and many more data two weeks after the end of the calendar year. A total of 13% have the P&L published with the gross profit only. For 11% of revenues, you see only the balance sheet, and about 1% of revenues come from private companies, where one must judge the revenues from information of suppliers mainly by getting the number of employees.
There is no general rule how to calculate the revenues of a company. It depends on the country. In the UK, for example, one looks for the trade debtors and can assume an average payment time of debts and thus calculate the annual revenues. In the European Union a new law implemented five years ago requires all companies to report the number of employees. (In Germany it is called Bilanzrichtlinie-Umsetzungsgesetz, or BilRUG.) As such, 97% of all employee data come from a primary source. This in part explains how in4ma is generating the European EMS statistics.
The general rule for the in4ma statistics is every individual number can be explained in detail. Analyses for growth rates by country are just simple additions of all the EMS companies of the country analyzed.
Logic says the market would be looking for precise numbers and use them. Wrong. There is no logic in the EMS market. Many EMS companies are managed by people who either overestimate themselves and think they know the market, or never learned what to do with market data and how to use them. Others use reports with lower numbers, as they suggest a higher market share and suggest they grew above average.
In fact, in 2017 the EMS industry in Europe had €36.097 billion in revenues, and the growth rates until 2022 will be more than 5% (FIGURE 2). (Sorry, I do not calculate to the hundredths decimal). This projection is the outcome of questions from the in4ma annual EMS statistics. For 2018, so far everything indicates the EMS industry in Europe had €37.9 billion in revenues. For Germany, growth in 2018 was 6%.
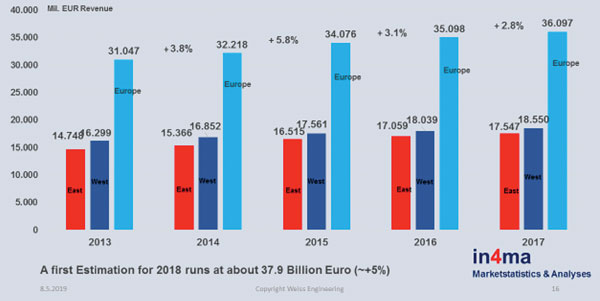
Figure 2. Revenues of 1,832 EMS/ODM companies in Europe, 2013-17.
The reason for the late numbers is simple. A primary analysis uses only numbers from primary sources, the majority of which in this case are the company registers. Companies are required to file annual reports six to 12 months after the end of their fiscal year, depending on the country. The biggest European EMS company is Foxconn, and it typically uses the full 12 months granted to file their reports. This causes a 12-month lag for the final numbers. Everything before that is just an estimate.
So, when buying a market report, make sure you ask beforehand how the analyst arrived at their numbers, where they got them, what calculations they made, and make sure market and production revenues are not mixed. The European market is European production value minus exports plus imports. This was more than €40 billion in 2017. There was an additional €70 billion in market potential, the approximate value of PCBA production of European OEMs. True numbers can be easily explained. Lies take a bit longer.
is a market analyst and founder of in4ma (in4ma.de); d.g.weiss@gmx.de.


Press Releases
- Niche Electronics Celebrates Completion of Florida Expansion
- Microscreen Names Nik Thomas Director, Expands Leadership Role Amid Continued Organizational Growth
- W&S Enters New Growth Phase Through Strategic Partnership and New Leadership
- Federal Electronics Expands Environmental Testing Capabilities with New Extended-Range Thermal Test Chamber