Determining Critical Cleaning Process Parameters for QFNs
A two-phase study to assess how to completely clean underneath leadless devices following soldering with Pb-free water soluble and Pb-free no-clean pastes.
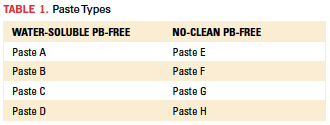
The goal of this study was to determine and validate the critical cleaning process parameters for QFN packages. Eight pastes were evaluated, including four water-soluble lead-free and four no-clean lead-free (Table 1). Since lead-free no-clean paste is considered the most challenging paste type for cleaning purposes, leaded paste options were not considered for this study.
The trials used an inline cleaner and an aqueous-based engineered dynamic surfactant cleaning agent. The cleaning agent was selected based on its ability to solubilize all paste types used in the study.
The DoE (design of experiment) was designed in two phases, ultimately analyzing four MLF configurations, including:
- MLF-20 – 5 x 5mm and 0.65mm pitch.
- MLF-44 – 7 x 7mm and 0.5mm pitch.
- MLF-68 – 10 x 10mm and 0.5mm pitch.
- Dual row MLF-156 – 12 x 12mm and 0.5mm pitch.
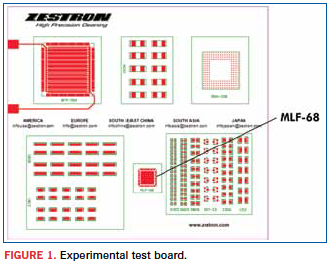
Phase 1: Determine the critical wash process parameters and cleaning equipment settings for QFN components. In this phase, only two pastes were used: one water-soluble and one no-clean. The test vehicle employed was the Zestron test board (Figure 1) populated with a single MLF-68 component. Once populated, the board was reflowed with an Ersa HotFlow 3/20, cleaned using an Electrovert Aquastorm 200 inline cleaner and visually inspected for surface and under-component residues using a Keyence VHX-1000 microscope. Following cleaning, the component was mechanically removed from the board to enable cleanliness analysis on the board surface under the component. Visual inspection was conducted in accordance with IPC-A-610E.1
To assist with the visual analysis, Zestron Flux and Resin test kits were utilized. These tests are nondestructive methods that identify the presence and local distribution of residues through a specific color reaction on the board surface. The flux test detects the presence of carboxylic-based flux activators; however, it does not detect residues based on halogenated activators. The resin test detects resin-based residues.
The DoE included the assessment of multiple variables such as concentration, spray configuration and belt speed. The cleanliness effect of these variables was plotted using Minitab software in order to determine the optimum wash parameters for the two paste types. Once determined, these optimum cleaning process parameters were used throughout the Phase 2 trials.
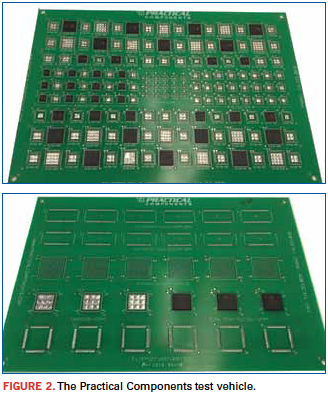
Phase 2: Utilizing process parameters from Phase 1, verify cleaning results using an industry standard test board. For this phase, the Practical Components PCB007 test vehicle (Figure 2) was used and populated with the four MLF component configurations. The boards were populated and reflowed at Rochester Institute of Technology. It can be seen from Figure 2 that the MLF-20, MLF-44 and MLF-68 components were populated on Side A of the board, whereas the dual-row MLF-156 components were populated on Side B. For this reason, the authors decided to process the boards in two stages. First, Side A was populated and reflowed at RIT and shipped to Zestron’s Technical Center, where they were cleaned within 24 hr. of reflow. The boards were analyzed for cleanliness and then returned to RIT to process Side B. Following processing, the boards were returned and cleaned within 24 hr. of reflow. Thus, all components were subject to only one reflow cycle prior to cleaning.
In each case, the assembled boards were cleaned using the Aquastorm cleaner. Following the cleaning process, all components were removed, and the substrate surface underneath the components was visually inspected for cleanliness. Also, ion chromatography analysis was conducted on the boards reserved for this purpose. At the time of this study, SIR tests were not conducted, since available QFN test boards did not have SIR testing capability.
Phase 1 methodology. For this phase of the study, Paste D and H were selected. The Zestron test vehicle was populated with a single MLF-68 component, reflowed, cleaned, and assessed for cleanliness. Based on the number of variables to be evaluated in the cleaning process, thirty-six assembled test vehicles were required, 18 with each paste type.
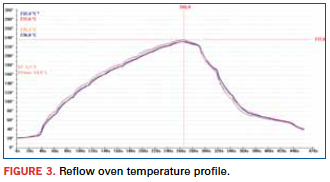
All test boards were reflowed using the Ersa oven and cleaned with the Aquastorm cleaner. Refer to Table 2 for reflow zone set points and Figure 3 for the documented reflow profile.

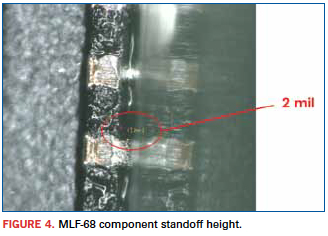
Achieving low-component standoff was critical for this study. Thus, visual inspection of the assembled board using a Keyence VHX-1000 microscope confirmed component standoff height at 2 mils (Figure 4).
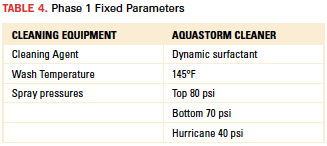
Regarding the cleaning process, a full factorial analysis of eight variables and their interaction for achieving optimum cleanliness was analyzed for each paste type. The variable and fixed parameters selected are detailed in Tables 3 and 4, respectively.

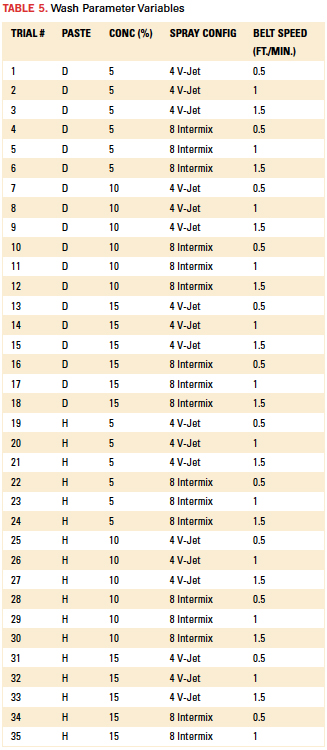
The full factorial matrix of wash parameter variables is detailed in Table 5. In total, this analysis included 36 trials. Following the wash process, cleanliness assessment was made through visual inspection of the board surface, as well as underneath the component. The flux and resin kits were used to facilitate identifying the presence of surface residues.
Phase 1 results: visual inspection. Visual inspection was conducted on the board surface, as well as under the component. As one would expect, the board surface was fully cleaned for both Paste D and H.
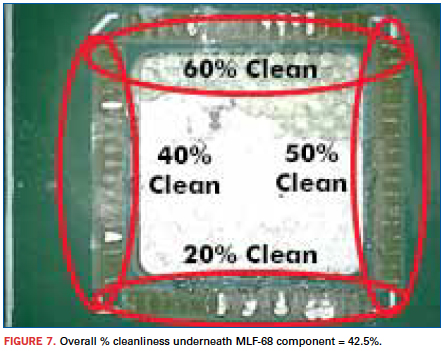
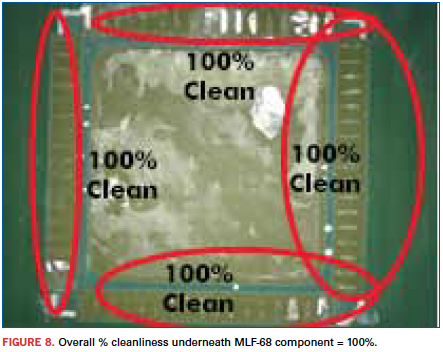
For assessment under the component, the MLF-68 component was mechanically removed from the board surface. To categorize the cleanliness level, the percent of area that was cleaned on each of the four sides of the MLF was estimated in percent format and the values averaged to obtain an overall cleanliness level for the whole component.
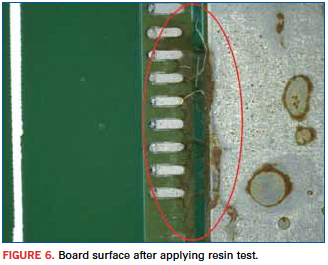
To facilitate the visual analysis, the flux and resin test kits were employed. The flux test was found to be non-reactive with the residues; however, the resin test produced a reaction indicating resin/rosin-based residues. The reaction results in a colored stain enabling the authors to estimate the percent of area that still has residues.
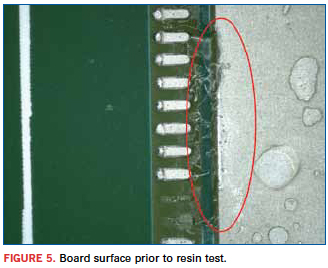
Figure 5 is representative of a board prior to applying the resin test. Figure 6 represents the same board after application of the resin test, clearly indicating the presence of residue. Figures 7 and 8 represent examples of the cleanliness level assessment for two cleaning trials.
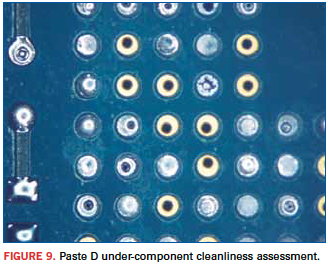
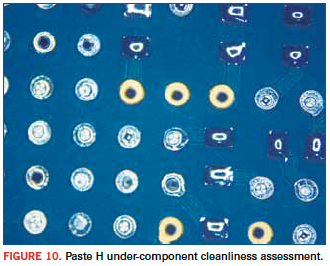
Cleanliness assessment results are detailed in Figures 9 and 10 (Appendix). In all tests with Pastes D and H, the board surface was easily and fully cleaned. As expected, the surface underneath the MLF component with Paste D (water-soluble) had significantly better results than Paste H (no-clean), confirming that flux type plays a critical role in the effectiveness of any cleaning system.
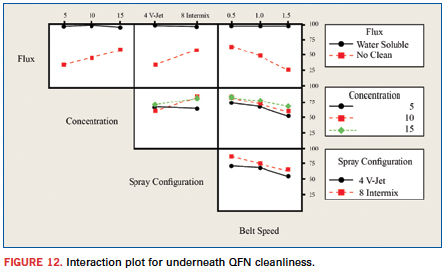
Phase 1 results: Minitab. Results detailed in Figures 9 and 10 were plotted using Minitab software for main effects (Figure 11) and interaction (Figure 12).
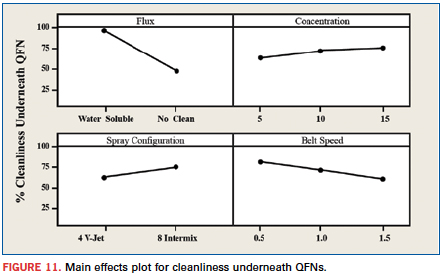
Main effects plot observations:
- The flux type is the most significant factor that determines cleanliness underneath the QFN.
- In general, higher concentration, slower belt speed and the eight spray bar intermix nozzle configuration yielded improved cleaning results.
Interaction plot observations:
- The concentration, belt speed and spray configuration do not play an important role in cleaning water-soluble fluxes from underneath the QFN component.
- For no-clean fluxes, significant improvement was observed using higher concentration, slower belt speed and an eight (8) spray bar intermix nozzle configuration.
Also, it should be noted that with regard to the no-clean paste (Paste H), full cleanliness was achieved at 0.5 fpm, 15% concentration with eight intermix nozzles. At 10% concentration, approximately 95% cleanliness was achieved. Thus, it was surmised that a more complex component, such as the dual-row MLF-156 and perhaps other no-clean paste types, may require higher wash temperatures to achieve full cleanliness. This proved true, and several trials within Phase 2 were conducted with a 155°F wash temperature.
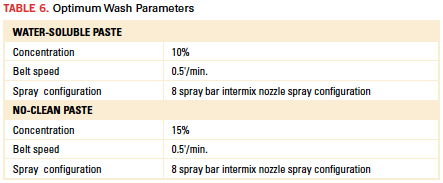
On the basis of these tests and observations, optimum wash parameters were identified (Table 6). It should be noted that the wash temperature was held constant at 145°F throughout the Phase 1 trials.
Next month: Phase 2 methodology and results.
References
1. IPC-TM-650, Test Methods Manual, Method 2.3.28, Ionic Analysis of Circuit Boards, Ion Chromatography Method. Visual inspection per IPC-A-610E, Acceptability of Printed Boards, 2010.
Ed.: This article was originally published in the Proceedings of SMTA Penang in April 2013, and is republished here with permission.
Umut Tosun is application technology manager; Naveen Ravindran is application engineer, and Michael McCutchen is the former vice president Americas and South Asia at Zestron; u.tosun@zestronusa.com.


