Soldering with Vacuum Profiles
Tests showed void content could be reduced under certain conditions.
Are there any benefits of soldering with vacuum profiles? To address this, we performed an evaluation using a test board, multiple stencils and multiple profiles. Herein are some of the obtained soldering results.
FIGURE 1 shows the overall layout of the test board, although only the components with ground connections were considered for this evaluation. Two identical apertures per variation were also included on each PCB.
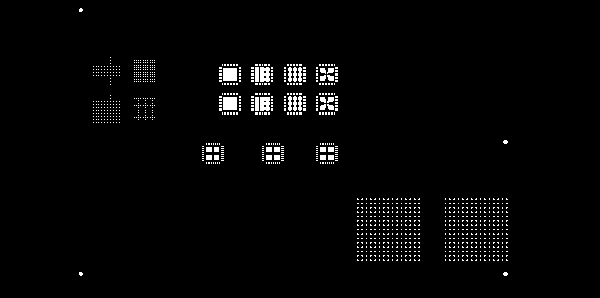
Figure 1. Layout of the test board with five different apertures for BTC components.
The two stencils varied with regard to thickness and the manufacturing process used. One stencil was used without any additional “finishing steps” and had a thickness of 120µm. The other group of boards was printed with a plasma-coated, electropolished variant and a stencil thickness of 110µm.
The difference between the soldering profiles is apparent in FIGURE 2. The results from the use of the controlled vacuum profile are depicted in FIGURE 2B. A so-called pre-vacuum was used in the preheating zone, which stabilizes the test procedure because the soldering tests were distributed over an entire day, and thus, for example, absorption of moisture into the solder paste flux chemistry might lead to distorted results.
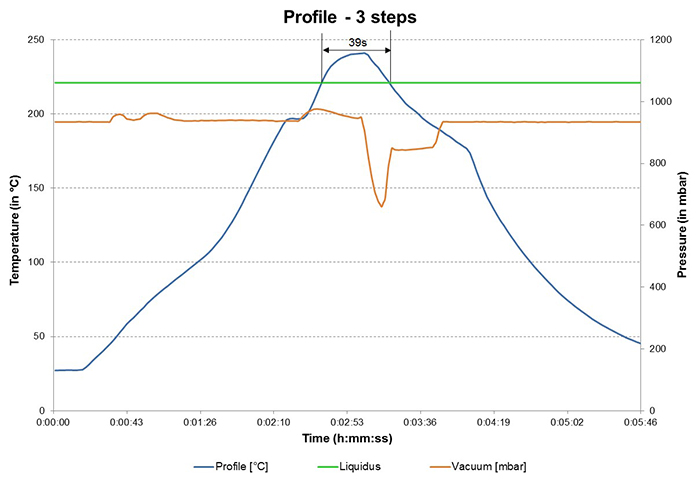
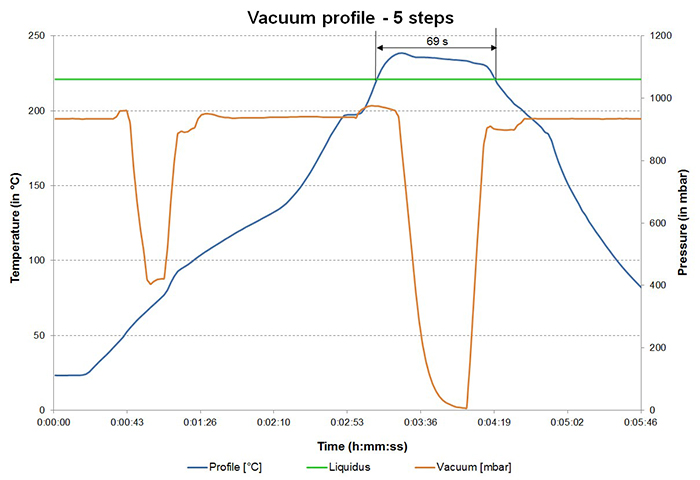
Figure 2. Soldering profile without vacuum (A) as opposed to a vacuum profile with 10 mbar and a dwell time of 10 sec. (B).
Stable conditions can be ensured by reducing pressure, which lowers the boiling point of liquids, therefore promoting ease of evaporation of volatile compounds like water, etc.
The use of the main vacuum extended the time above liquidus by 30 sec. in order to reduce the number and formation of voids. Because the void reduction process has to be conducted for the most part in the molten state and must not be run too quickly, a longer period in the melting phase of the solder alloy has to be accepted. A final pressure of 10 mbar and a dwell time of 10 sec. were selected to achieve the following results.
A comparison of the soldering results for these two profiles is depicted in FIGURE 3. Minor differences between aperture-related results can be detected here, although they cannot be classified as significant. The results obtained with a vacuum pressure of 10 mbar are significant: All solder joints were produced with a void content of less than 2%.
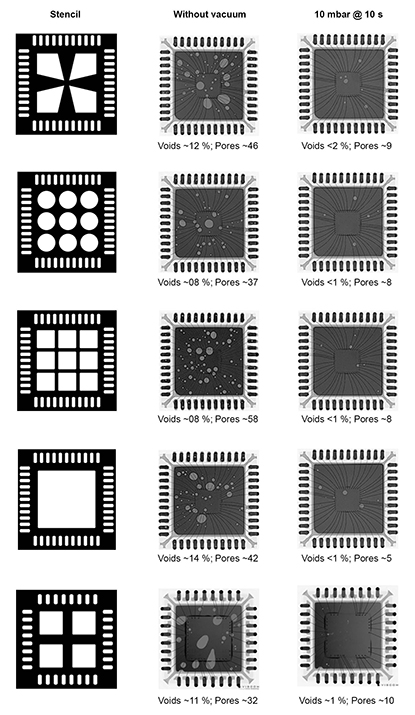
Figure 3. Comparison of stencil geometry with and without vacuum process.
The results in FIGURE 4 show the extreme comparison of soldering at ambient pressure and with a vacuum of 10 mbar and 100 mbar. The void content (<3%) and number of voids were significantly reduced.
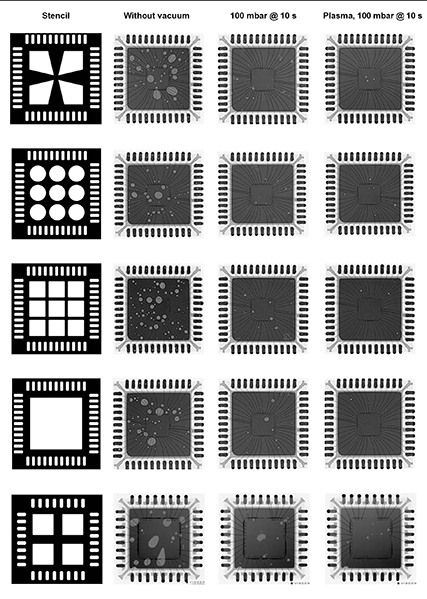
Figure 4. Comparison of stencil geometry, stencil type and soldering process.
Beyond this, the aperture geometry and stencil type have a less significant influence on vacuum soldering results. However, one gains the subjective impression that in this case the plasma stencil has the tendency to leave somewhat less voiding, which could possibly be traced back to better release of the wet paste and the associated dimensional stability. As such, the stable, uniform paste release would have to be taken into consideration as an influencing parameter.
Summary
Soldering with targeted use of vacuum can contribute to a considerable reduction of the number of voids and void content. To ensure no negative effects such as damage to sensitive components or solder splashing, it should be possible to profile the pressure curve like a temperature profile. The use of different aperture geometries or variously coated stencils doesn’t necessarily result in significant differences during vacuum soldering.
The hypothesis involving outgassing ducts was not confirmed in this case because they disappear in the preheating zone. To a much greater extent, partitioning of a large ground pad can have a positive effect on wet paste print characteristics and wet paste print stability (e.g., see scooping), which may lead to better results. Nor can any single vacuum pressure value be specified that always yields best possible results. Depending on the wet paste layer thickness, the solder paste and the stencil aperture, results of less than 2% void content can be attained with vacuum pressure values ranging from 10 to 100 mbar.
is head of application and product management, Rehm Thermal Systems (rehm-group.com); h.oettl@rehm-group.com.
Press Releases
- Kitron Autonomous Defence Systems Agreement Increased to EUR 12M
- Keiron Printing Technologies Appoints BarTron, Inc. as Sales Representative for Midwest and Ohio Valley Regions
- CalcuQuote rebrands within Elisa Industriq, strengthening a unified market presence
- Pillarhouse USA announces appointment of Lean Stream in Northern California and Northern Nevada Regions


