Impact of Multiple Thermal Cycles on the Cleaning Process
A study finds wash conveyor belt speed to be a significant factor in cleaning system efficiency.
Multiple thermal cycles may be required for a variety of reasons in the production of PCBs. If the board includes mixed technology (SMT and through-hole), it will be processed through both a reflow oven and wave solder system. Also, depending on the complexity of the PCB design – inclusion of stacked components or double-sided circuitry, for example – multiple reflows may be required.
As greater functionality from smaller components is sought, use of µBGAs (micro ball grid arrays) and CSP (chip scale packaging) is increasing. Due to package geometry, standoff height between the component and board decreases, thereby reducing component reliability resulting from mechanical shock. Reliability can be increased with the use of underfill. Underfill encapsulates the bottom side of the silicon chip, improving the package’s mechanical and thermal properties.1 However, underfills require a baking process for curing, adding a thermal cycle to the PCB manufacturing process.
Multiple thermal cycles can certainly polymerize or burn in flux residues. If a cleaning process is not incorporated into PCB manufacturing, these burnt-on residues become significantly more difficult to solubilize and remove. The difficulty of removing these burnt-on residues will vary with the type of paste used that is RMA, no-clean or water-soluble.
Whether a PCB is subjected to single or multiple reflow cycles, many manufacturers will use ICT to check for PCB shorts, opens and power test, among other variables, to detect whether the assembly was manufactured correctly.2 Typically, ICT involves inserting pins from the test fixture onto the component test points.
As component test points may be covered with polymerized flux from multiple reflow cycles, however, the pins are unable to penetrate the residue, and the test cannot be performed. Thus, these residues must be removed.
This study was undertaken to assess the impact of multiple thermal cycles on the effectiveness of the cleaning process for PCBs. Regardless of the use of underfill, or the need for ICT, burnt-on flux residues can reduce component and/or substrate reliability, thereby contributing to field failures.3 The ability to remove these residues is essential, and understanding the impact of multiple thermal cycles on flux removal is critical to developing a cleaning process solution.
Methodology
For this study, the authors considered the effect of three thermal cycle variations, including single reflow, dual reflow and dual reflow plus baked-on flux removal from soldered PCBs. Test vehicles were populated with numerous types of chip cap capacitors using various no-clean (one leaded; two lead-free), RMA (one leaded; one lead-free) and water-soluble (one leaded; one lead-free) solder pastes. In total, seven different solder pastes were used (TABLE 1).
Table 1. Solder Paste Type
Following each thermal cycle variation, the substrates were cleaned using inline aqueous cleaning equipment. For comparative purposes, all substrates were cleaned with two different micro-phase cleaning agents, identified as Cleaning Agent A and Cleaning Agent B. Cleaning Agent A has a slightly lower surface tension and is slightly more alkaline compared to Cleaning Agent B. Additionally, the boards prepared with water-soluble pastes were also cleaned with DI-water, enabling cleaning performance comparison with the engineered cleaning agents.
It is important to note the cleaning process employed for this study was not optimized for each thermal cycle variation, cleaning agent used or residue types to be removed. Rather, baseline cleaning process parameters were established for the single reflow process and maintained constant throughout all of the trials, as the main study objective was to assess the relative impact of thermal cycles on the cleaning process. The authors benchmarked the selected cleaning process using the two different cleaning agents and DI-water following the single reflow heat cycle. Thus, all cleaning process parameters were held constant for all cleaning trials, regardless of the number of thermal cycles. This includes cleaning agent concentration, wash temperature, number of spray bars, number and type of nozzles and spray bar pressure. However, the authors decided to assess the effect of conveyor belt speed or wash exposure time on residue removal. Three conveyor belt speeds, 2 ft./min., 1 ft./min. and 0.5 ft./min. yielding wash times of 2.6 min., 5.2 min., and 10.4 min., respectively, were used for each paste and thermal cycle permutation.
Cleanliness assessments were performed through both visual inspection and IC analysis per the latest IPC test method standards.4 Visual inspection was conducted on the surface, as well as underneath the components. For under-component cleanliness inspection, all components were removed from the substrate.
Given the number of pastes, thermal cycles, cleaning agents and wash exposure times considered, 144 test boards were prepared for this study, each populated with 45 chip cap components (TABLE 2).
Table 2. Thermal Cycle Test Vehicles
Additionally, nine populated boards were prepared for cleanliness assessment using IC analysis. For these tests, the authors evaluated cleanliness assessment for each paste type, considering only dual reflow thermal cycle and 1 ft./min. wash conveyor belt speed. Boards prepared with all paste types were cleaned with only Cleaning Agent B, whereas the boards prepared with water-soluble pastes were also cleaned with DI-water (TABLE 3).
Table 3. Ion Chromatography Test Parameters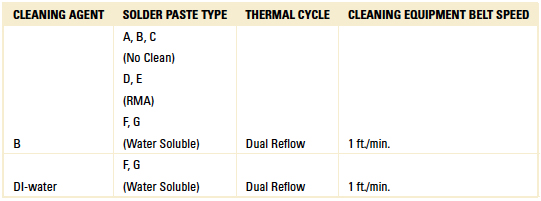
Main Research
Test vehicle protocol. The corporate test vehicle (FIGURE 1) was used for all trials and populated with five chip cap components each for a total of 45 components per substrate (TABLE 4). BGA and MLF components were not considered for this study.
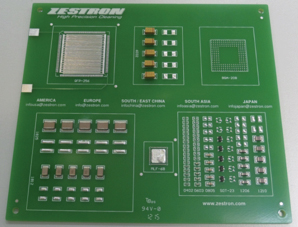
Figure 1. Test vehicle.
Table 4. Component Type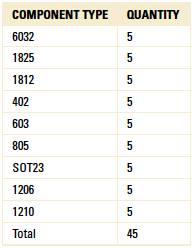
Three thermal cycle variations were employed for this study:
- Single reflow.
- Dual reflow.
- Dual reflow + B (bake).
For each thermal cycle variation, paste type used, and wash conveyor belt speed selected, one populated test vehicle was used and analyzed for cleanliness.
A reflow oven was used for all the thermal cycle variations. As boards were assembled with either leaded or lead-free pastes, two reflow profiles were established (TABLES 5 and 6).
Table 5. Leaded Reflow Profile
Table 6. Lead-Free Reflow Profile
For the dual reflow process, the identical leaded and/or lead-free reflow profiles were used for each cycle. For dual reflow, the boards were reflowed within 15 min. of initial reflow cycle.
For those boards subjected to the baking process following the second reflow, they were immediately placed in an oven upon exiting the second reflow. The bake process parameters were 125°C for a duration of 2 hr. Regardless of the thermal cycle process employed, all boards were processed through the cleaning system within 24 hr.
Cleaning process protocol. The authors benchmarked the selected PCB cleaning process using the single reflow thermal cycle. For comparative purposes, identical cleaning process parameters were used for all cleaning trials, regardless of the paste type used or the number of thermal cycles to which the PCBs were subjected.
Following the thermal cycle process, all substrates were cleaned utilizing inline cleaning equipment. Comparative trials were completed using two aqueous-based micro-phase cleaning agents, Cleaning Agent A and Cleaning Agent B. For the substrates assembled with water-soluble pastes, they were cleaned with DI-water, as well as the aqueous-based cleaning agents.
The inline cleaning process parameters were held constant for all trials and are detailed in TABLE 7.
Table 7. Inline Cleaner Parameters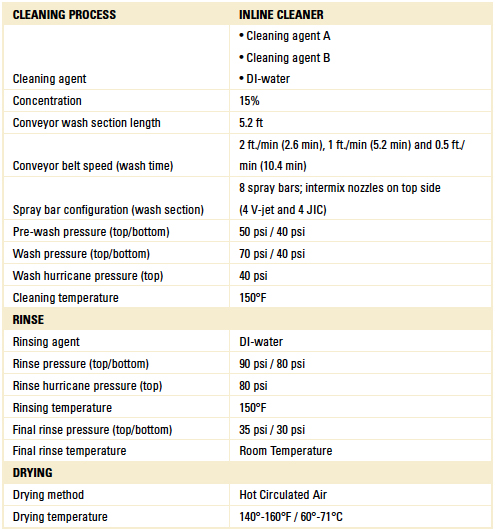
Cleanliness assessment. For each thermal cycle variation, cleaning effectiveness was assessed on the basis of visual inspection. Visual inspection was conducted on the board surface, as well as under-component. For under-component inspection, all components were removed from the PCB, and the under-component surface rated as either fully cleaned or not cleaned. Partial cleanliness was not considered a positive result.
IC analysis per IPC-TM-650, Method 2.3.28.2 was completed on one set of boards: seven boards (all paste types) cleaned with Cleaning Agent B and two boards (water-soluble paste only) cleaned with DI-water (Table 3).
Results
In total, 144 test boards were prepared, and 144 cleaning trial permutations were conducted (TABLE 8).
Table 8. Thermal Cycle Cleaning Trial Permutations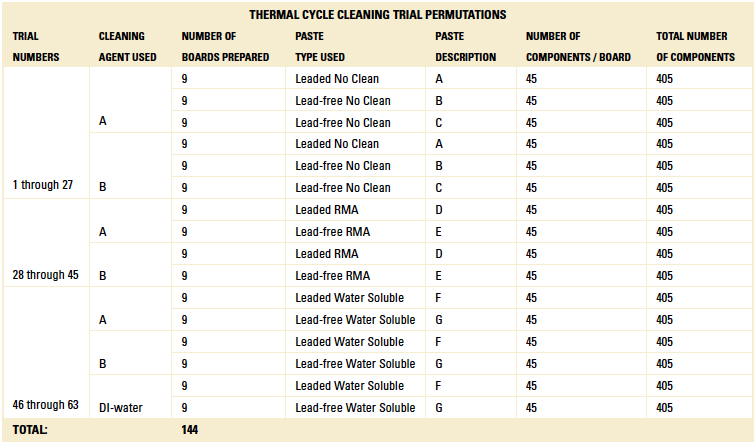
Surface cleanliness assessment. Reference TABLES 9, 10 and 11 for surface cleanliness assessment results.
Table 9. Leaded and Lead-Free No Clean Pastes Surface Cleanliness Assessment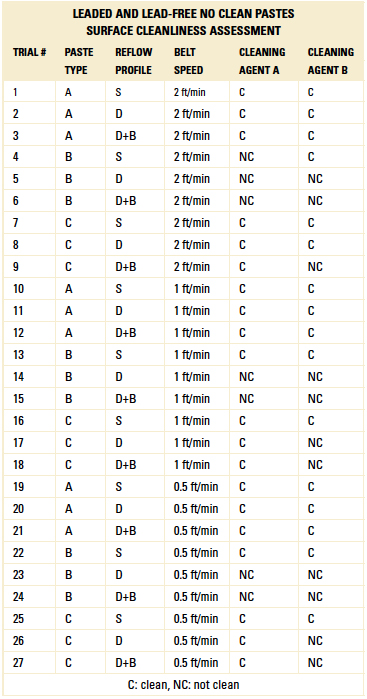
Table 10. RMA Paste Surface Cleanliness Assessment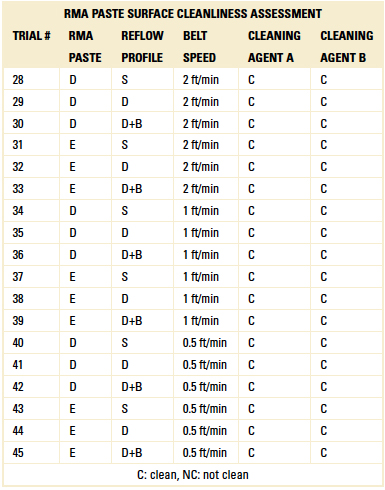
Table 11. Water Soluble Paste Surface Cleanliness Assessment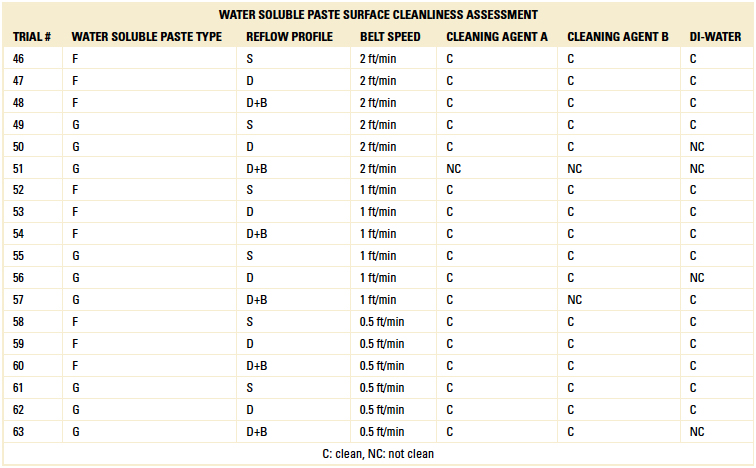
As detailed in Table 9, Cleaning Agents A and B resulted in a fully cleaned board surface for leaded no-clean Paste A for all thermal and conveyor belt wash speed conditions. Cleaning Agent A fully cleaned Paste C under all thermal conditions and wash conveyor belt speed conditions. Paste B was the most difficult to clean. For Paste B, both cleaning agents fully cleaned the surface after a single reflow at 1 ft./min. and 0.5 ft./min., but failed to clean the surface following dual and dual reflow and bake.
As detailed in Table 10, both Cleaning Agent A and Cleaning Agent B resulted in a fully cleaned board surface for the RMA paste for all thermal conditions and wash conveyor belt speed.
As detailed in Table 11, DI-water, Cleaning Agent A and Cleaning Agent B fully cleaned the board surface for the leaded Paste F under all thermal conditions and wash conveyor belt speeds. Cleaning Agent A fully cleaned the lead-free Paste G board surface for all thermal conditions at both 1 ft./min. and 0.5 ft./min., whereas Cleaning Agent B fully cleaned the board surface for all thermal conditions at 0.5 ft./min. only.
FIGURES 2, 3 and 4 show examples of the visual inspection surface conditions not cleaned (NC) identified in Tables 9, 10 and 11.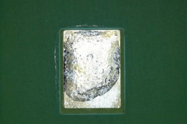
Figure 2. Wetness.
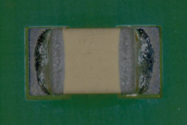
Figure 3. White residue.
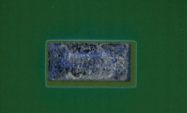
Figure 4. White film.
Under-component cleanliness assessment. Under-component cleanliness assessment results are detailed in FIGURES 5 through 20.
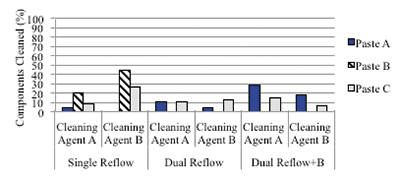
Figure 5. Under-component cleanliness – No-clean solder paste impact, 2 ft./min.
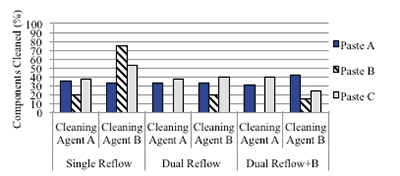
Figure 6. Under-component cleanliness – No-clean solder paste impact, 1 ft./min.
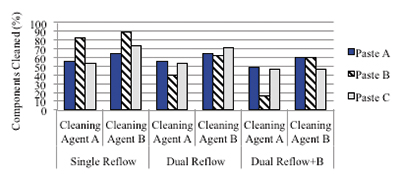
Figure 7. Under-component cleanliness – No-clean solder paste impact, 0.5 ft./min.
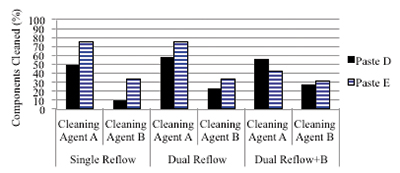
Figure 8. Under-component cleanliness – No-clean solder paste impact, 2 ft./min.
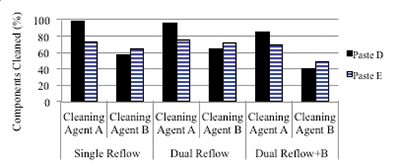
Figure 9. Under-component cleanliness – RMA solder paste impact, 1 ft./min.
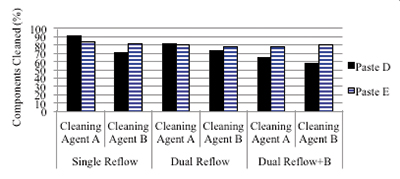
Figure 10. Under-component cleanliness – RMA solder paste impact, 0.5 ft./min.
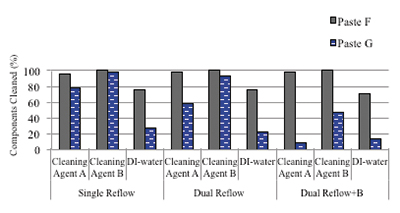
Figure 11. Under-component cleanliness – OA solder paste impact, 2 ft./min.
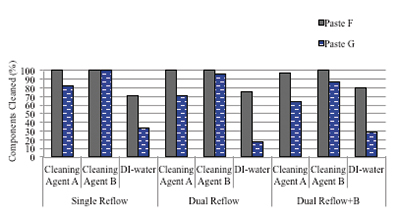
Figure 12. Under-component cleanliness – OA solder paste impact, 1 ft./min.
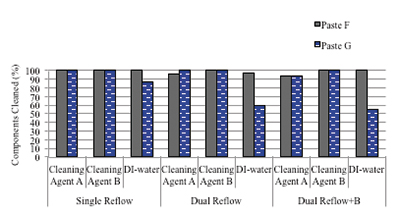
Figure 13. Under-component cleanliness – OA solder paste impact, 0.5 ft./min.
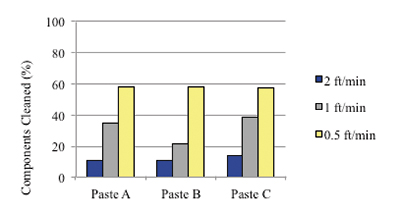
Figure 14. Under-component cleanliness belt speed impact – no-clean.
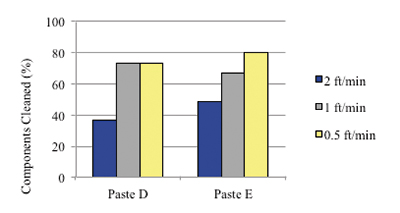
Figure 15. Under-component cleanliness, belt speed impact – RMA.
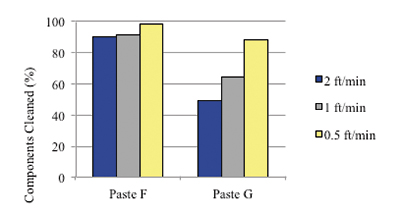
Figure 16. Under-component cleanliness, belt speed impact – OA.
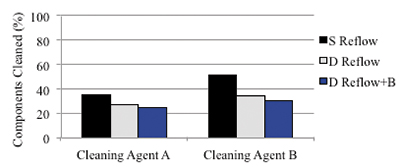
Figure 17. Under-component cleanliness, multiple thermal cycle impact – no-clean.
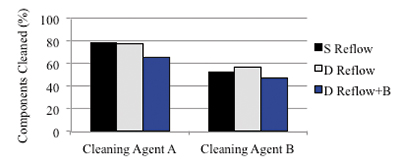
Figure 18. Under-component cleanliness, multiple thermal cycle impact – RMA.
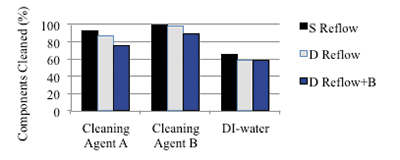
Figure 19. Under-component cleanliness, multiple thermal cycle impact – OA.
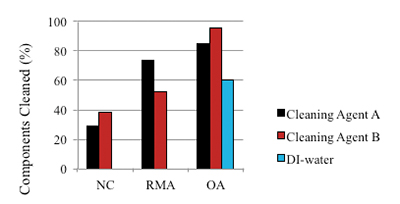
Figure 20. Under-component cleanliness – Cleaning agent comparison.
Figures 5 through 13 represent the impact of solder paste type on under-component cleanliness at each wash conveyor belt speed and for each
thermal cycle variation. The total number of components cleaned by the specified cleaning agent for the selected thermal cycle was counted. The percent components cleaned depicted within each bar graph is based on a total potential of 45 components (one board at 45 components each).
Figures 14, 15 and 16 represent the impact of wash conveyor belt speed on under-component cleanliness for each solder paste type. The total number of components cleaned for all thermal cycle variations and by all cleaning agents for each solder paste was counted. The percent components cleaned depicted within each bar graph is based on a total potential of 270 components (six boards at 45 components each) for Pastes A, B, C, D, & E and 405 components for Pastes F and G.
Figures 17, 18 and 19 represent the impact of each thermal cycle variation on the cleaning efficacy of each cleaning agent. The total number of components cleaned within the specified paste group with each cleaning agent and at all wash conveyor belt speeds was counted. The percent components cleaned depicted within each bar graph is based on a total potential of 405 components for Pastes A, B and C (9 boards at 45 components each) and 270 components for Pastes D, E, F and G (six boards at 45 components each).
Figure 20 is a summary of all components cleaned by cleaning agent type from each thermal cycle variation and each conveyor belt speed within each paste group. The total number of components cleaned within the specified paste group with each cleaning agent and at all wash conveyor belt speeds was counted.
The percent components cleaned depicted within each bar graph is based on a total potential of 1,215 components for Pastes A, B and C (27 boards with 45 components each) and 810 components for Pastes D, E, F and G (18 boards with 45 components each).
Ion chromatography results. For the IC analysis, soldered test vehicles were prepared with all seven pastes and the dual reflow thermal cycle. Seven boards (all paste types) were cleaned with Cleaning Agent B, and two additional boards (water-soluble pastes only) were cleaned with DI-water. All boards were cleaned at 1 ft./min. wash conveyor belt speed.
IC analysis was conducted on nine boards. All boards passed ion chromatography (TABLE 12).
Table 12. Ion Chromatography Results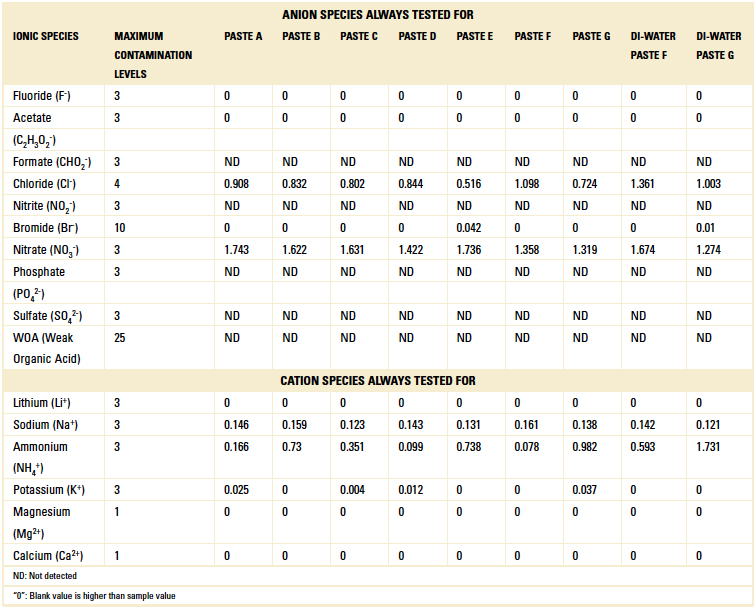
Conclusions
As a general overview of the study results, increasing the number of thermal cycles a substrate is exposed to without cleaning in between cycles denigrates process cleaning performance regardless of the solder paste type used and/or cleaning agents selected. Under-component cleanliness was most difficult to achieve following multiple thermal cycles with the no-clean solder pastes. Anecdotally, electronics manufacturers that utilize no-clean solder paste and require use of ICT have complained to solder paste suppliers of the difficulty to conduct ICT with substrates that have been subjected to multiple thermal cycles, further supporting the study conclusion.
Cleaning equipment conveyor belt speed had a significant impact on under-component cleanliness levels achieved, particularly with the no-clean solder pastes (Figures 14 to 16).
Surface cleanliness assessment. A high level of surface cleanliness was achieved by both Cleaning Agent A and Cleaning Agent B with all RMA and water-soluble pastes, although longer wash times (1 ft./min. and 0.5 ft./min. belt speed) were required for Paste G. DI-water was unable to fully clean Paste G (Table 11).
For the leaded no-clean solder Paste A, the surface was fully cleaned by both cleaning agents under all thermal conditions and wash conveyor belt speeds. For no-clean lead-free solder Paste C, the surface was fully cleaned by Cleaning Agent A under all thermal conditions and wash conveyor belt speeds. For the lead-free solder Paste B, both cleaning agents left surface residue following multiple thermal cycles (Table 9).
Under-component cleanliness assessment. Upon considering overall under-component assessment (Figure 20), Cleaning Agent B outperformed Cleaning Agent A for both the no-clean (39% vs. 29%) and water-soluble (96% vs. 85%) solder pastes.
Both Cleaning Agent A and Cleaning Agent B outperformed DI-water. However, Cleaning Agent A outperformed Cleaning Agent B with regard to RMA solder pastes (74% vs. 52%). Matching the cleaning agent to the residue is critical in order to maximize cleaning system performance.
General Observations
As the number of thermal cycles increases, cleaning process efficacy decreases, regardless of the cleaning agent used.
Wash conveyor belt speed is a significant factor in cleaning system efficiency, regardless of the number of thermal cycles. This was particularly evident with the no-clean solder pastes. However, significant cleaning improvements resulted with the RMA Paste D, Paste E and water-soluble Paste G as well.
Cleaning effectiveness following multiple thermal cycles is greatly affected by solder paste type and cleaning agent selection. No-clean solder pastes proved to be the most difficult to clean; however, results were greatly influenced by wash conveyor belt speed.
Ideally, substrates exposed to multiple thermal cycles should be cleaned immediately following each thermal cycle. Regardless of cleaning agent, cleaning process type and wash exposure time significantly impact cleaning system performance. Regardless of the number of thermal cycles, the cleaning process requires optimization to ensure the most effective results.
References
1. Michael Yu and Syed Wasif Ali, “Underfill Revisited: How a Decades-old Technique Enables Smaller, More Durable PCBs,” Embedded.com, Jan. 27, 2011.
2. Jun Balangue, “Successful ICT Boundary Scan Implementation,” PRINTED CIRCUIT DESIGN & FAB/CIRCUITS ASSEMBLY, September 2010.
3. Harald Wack, Ph. D., “DI-water vs. Chemistry,” SMT, June 2008.
4. Visual inspection according to IPC-A-610E, Acceptability of Printed Boards, 2010.
Ed.: This article was originally published in the Proceedings of SMTA International, September 2015, and is republished here with the authors’ permission.
, M.S.Ch.E., is application technology manager and , M.S.Ch.E., is senior applications engineer at Zestron Americas (zestronusa.com); umut.tosun@zestronusa.com.


