

Current Issue
Improved Maintenance and Reliability for Large-Volume Underfill Processes
Proven methods of mitigating dot variations and attaining three weeks between maintenance intervals.
To enhance the reliability of many handheld communication devices, the electronics assembly industry has been hunting for materials that can meet an unprecedented array of complex and demanding requirements such as high glass transition temperature (Tg) and high modulus, low-temperature fast cure, and processability. Underfill development has also accelerated through the introduction of epoxy-based laminates for package-on-package (PoP), wafer-level chip-scale packages (WLCSP), chip-scale packages (CSP) and ball grid array (BGA) devices.
Flip-chip applications must redistribute stress away from solder joints to extend thermal aging and product life. Some flip-chip underfills are formulated with high percentages of specialty fillers to counter such problems. This also permits a low coefficient of thermal expansion (CTE), which helps flip-chip encapsulants to flow fast in small gaps, possess high Tg and high modulus.
Underfills are generally made of two-part epoxies. These are packaged tightly in syringes to avoid contaminants and eliminate air from entering the syringe. They are then stored in a freezer at a temperature of -40˚C. These kinds of underfills have a shelf life of 12 months from the date of manufacture specified on the content label. Materials need to be removed from the freezer to thaw for at least one hour at room temperature to be workable. In the thawing process, two-part epoxies begin to react slowly, and viscosity can increase, in some cases by 25 to 30%. Manufacturers advise using the underfill syringe completely within the product’s recommended work life. Many materials have extended work life, in some cases reaching three days at room temperature.
The goal of the underfill process is to dispense the required volume of material to completely underfill the die and form a fillet around the edges without having material extend outside a predetermined keep-out area. The required dispensed volume (VD) is the volume of total area between the die and the board (VA), minus the volume of the bumps (VB), plus the volume of fluid in the fillet around the die (VF) (FIGURE 1).
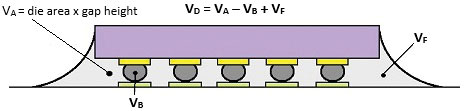
Figure 1. Dispense volume calculations.
If more fluidic volume is dispensed, then the fillet will be outside its designated keep-out area, and if less fluidic volume is dispensed, then the die has insufficient volume, which leads to air pockets that reduce the reliability of the BGA joint. In both cases, either there is fluid on top of the component or variation of volume underneath the die, which is unacceptable, leading to rework.
Applying capillary and no-flow underfill processes can be accomplished through various methods, mainly needle dispense or jetting operations. In high-volume assembly operations involving underfill, a series of problems, along with some innovative solutions, have occurred to achieve a sustainable production process.
One of the most common problems is maintaining the dispensed volume of material over the chip and avoiding any contamination over the adjacent parts.
Streaming technology has rapidly evolved for applying underfill, replacing jetting in many high-volume applications due to fundamental differences in its method of operation. Jetting technology uses a ball and seat mechanism; to supply the fluid to the ball seat area, air pressure is applied to the syringe, which forces the fluid to fill the seat. As the ball moves in the downward direction to strike the seat, it drives the fluid in the form of a drop to dispense on the substrate. Streaming technology fills a cylindrical cavity of a known volume, and a piston mechanically displaces the volume of the chamber. The major differentiation from jetting is the piston streams out material without striking a hard stop, unlike what is done in the ball and seat mechanism of a jet.
Pump flow rate is defined as the desired mass or volume of underfill dispensed from the pump over time. Accurate flow rate is needed since product quality depends on the volume of underfill dispensed. Most pump technologies offer automatic weight monitoring through a programmed weight scale measurement that controls pump output. Significant changes in flow rate occur over the pot life of the material as the viscosity increases. Time-pressure and rotary auger dispensing is most susceptible to this issue. Measurement of the flow rate is required periodically. Adjusting the dispense volume will ensure the process is kept close to the target. In many HVM assembly applications, larger flow rates of 30 to 50mg per second are becoming more common, but due to the volume of material required for the process they generally suffer from large dispense-edge fillets. Reducing the fillet size by reducing flow rates significantly slows the dispensing process, leading to reduced throughput.
FIGURE 2 is a plot of viscosity over time for an underfill fluid during an assembly production run. The viscosity of fluid increases as the fluid starts getting into the path of the moving parts. Automated fluid dispensing equipment has built-in mass flow control systems, which react to the change in volume to accommodate changes in viscosity. Under normally steady state conditions without any mass flow control, the fluid weight tends to reduce over time. To compensate for fluid volume changes, the dispense line speed is reduced to obtain the same weight of fluid on the part with auger dispensing. With jet dispensing, the number of fired dots is adjusted to add more fluid, thus increasing the cycle time for the process. Streaming incorporates a continuous stream of fluid of precise volume kept consistent by varying piston travel; the number of cycles never changes, keeping throughput constant.
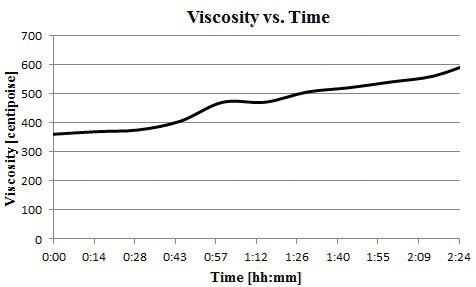
Figure 2. Viscosity vs. time.
Factors Affecting the Dispensing Volume
Dead volume spaces. Dead volume spaces are locations inside of a fluid path where the material is stagnant and not constantly refreshed. The wetted parts inside the fluidic chamber include consumable parts like O-rings or cup-seals for keeping the chamber sealed. A major problem typically seen during production is curing material inside the dispensing fluidic/pump body. Curing generally occurs because of the dead volume spaces created within the fluidic/pump body. Material gets trapped within the dead spaces and never gets replenished with fresh material flowing through the pump body. This trapped material tends to age as a result of an ongoing slow reaction between the constituents during and after the product’s recommended working life, which leads to required pump maintenance before the material can damage the pump.
Streaming theory of operation. Streaming epoxies and other materials is changing the way people think of dispensing. For the past 20 years, dispensing has evolved from pushing fluid through a needle using air pressure to a highly automated production process with linear positive dispensing pumps, auger pumps and jets. Controlling fluid deposition, needle position and dispensed volume accuracy has dramatically improved in recent years.
Streaming pump technology refers to volumetrically displacing (streaming) the fluid onto the substrate, rather than firing the material as dots such as jetting.
Streaming technology functions without the piston striking a hard stop or seat within the fluid chamber to eject material out of the nozzle. The fluid is driven into a cylindrical chamber when the piston is retracted; the reciprocating motion of the piston then pushes material through the chamber during the downward motion, delivering the fluid through the nozzle. Streaming eliminates wear and tear of hardware parts found in other technologies (such as piston and seat wear). This helps maintain prolonged life of the hardware system, since there is no mechanical piston-seat interaction. As a result, streaming operates at lower decibels than jetting, thus reducing noise pollution.
Streaming technology incorporates two important materials, namely carbides and sapphires. Both materials are used to design the orifice, which is used as a replacement of a nozzle whose inner diameter can be varied depending on the shot size requirement for a particular application type. While in operation, each cycle can dispense an increased amount of material compared to a single sphere. The piston is driven by a closed loop linear encoder servo motor that controls the z-axis motion, which sets up the charge for a particular shot size. Streaming has both combined advantages of a positive piston displacement pump and jetting technology to deliver, in a noncontact fashion, a continuous stream of fluid in a precise amount of volume, as shown in FIGURE 3.
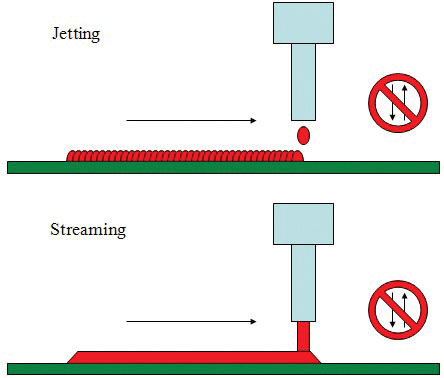
Figure 3. Jetting versus streaming technology.
Technological advantages. Streaming technology has similar attributes as jetting technology; it has an edge in terms of application of underfills. Streaming technology works on the positive piston displacement principle; the mechanical piston moves in the downward direction, pushing fluid in the cylinder chamber opening to create a miniature stream of material from the needle or nozzle tip without wear or abrasion. The inner dimension of the needle, whether it is flat or tapered, affects the flow rate of the fluid with time, which affects dispensing quality. This technology has undergone extensive testing to provide better results to dispense high-volume dots in a consistent manner.
Underfill is a necessity when manufacturing miniaturized portable electronic devices to hold semiconductors in place and increase product reliability. Using streaming technology for this application, there are some major advantages:
- Throughput improvement: Elimination of z-axis travel and reduction of height sensing steps to locate the distance of the dispense location between the needle and substrate can reduce the cycle time by 25% compared to legacy needle contact dispensing.
- Reduced wear of mechanical parts compared to jetting: Mechanical ball/seat interactions are eliminated in streaming. This increases the life of mechanical parts, as well as provides much quieter operation.
- Increased throughput: The volumetric nature of streaming permits variable shot weight per piston stroke length; a single individual cycle of streamed material can replace several cycles of jetting material, reducing pump cycles, thus increasing throughput.
- Fewer consumables: Only two low-cost seals are required per pump cleaning, which lowers cost of ownership compared to other pump technologies.
- Lower maintenance: In field tests, HVM assemblers have run 24/7 production with zero pump maintenance for up to 21 days.
Experimental Setup and Analysis
The main objective of this research is to conduct a detailed study to repeatedly dispense a high volume of fluid, amounting to a deposition size less than or equivalent to 1.000mg per shot using streaming technology. The study involved use of a high-speed dispensing system with a positive displacement pump installed, which can currently dispense 1.000mg per shot in a repeatable manner without affecting the dot quality.
The study began at a point of performing the experiment on a positive displacement pump involving different process parameters such as charge, updwell, syringe air pressure, adjustable bumper offset and nozzle size (FIGURE 4). The charge value was kept constant, which is the distance traveled by the piston when raised from its home position to the upstroke. Each stroke of the piston expels the fluid contained in the displacement volume of the piston chamber. The displaced volume is the volume between the bottom of the feed slots and bottom stroke of the piston. The vertical chamber feed slots help avoid any creation of dead volume spaces due to pressure waves generated from incoming fluid into the pump body. An adjustable bumper was used to limit penetration of the piston into the displacement cylinder. Less penetration of the piston will displace less fluid.
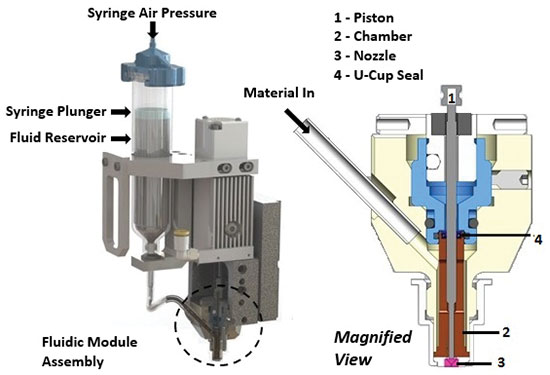
Figure 4. Schematic diagram of positive displacement dispensing pump.
The adjustable bumper offset was set to limit displacement volume to yield approximately 1.000mg per dot. High syringe pressures ranging from 10 to 20psi (pounds per square inch) were used to ensure complete filling and reduced sensitivity in the shot size versus charge relationship. Higher syringe pressures promote smooth movement of the syringe plunger from top to bottom. Less sensitivity to charge improves shot volume repeatability and accuracy. By increasing the bumper offset, the region of stability can be moved to compensate for the different weights. It is desirable to use a relatively small charge value and relatively high syringe pressure. A nozzle heater was used to maintain the fluid temperature equivalent to ambient temperature conditions. The study concluded by running the experimental run in a longevity test to confirm the robustness of the hardware configuration with minimal effect on the dot volume.
The experiment was conducted for a shot size (single pump cycle) equivalent to 1.000mg with total weight ranging from 5 to 50mgs. The experiment is intended to investigate the shot size by dispensing the material into a cup placed on a precision scale. The standard process program involves dispensing five to 50 shots into the weight measuring cup and collecting 25 weight samples.
FIGURE 5 shows the box plot of variation of shot size versus total dispensed weight. The box plot provides the graphical distribution of the shot size of 25 samples for total dispensed weight ranging from 5 to 50mg. The median shot size is stable across different total weights, while the variability decreases with an increase in the total weight. Total weight of 5mg exhibits the greatest variability, with an interquartile range of 0.020mg. The interquartile range box for larger total weights is smaller compared to the sample with total weight of 5mg. The extreme values are closer to the median for larger total weights. Most of the data points lie within ±2% tolerance across the target shot size of 1.000mg per dot.
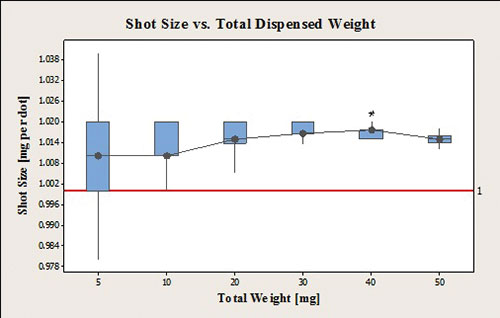
Figure 5. Box plot of shot size versus total dispensed weight.
The shot size versus charge relationship is determined through pump characterization. This utility dispenses and weighs the output of the pump through a desired range of charge. Typically at each charge setting, the pump will purge, clean the nozzle and dispense the number of shots defined by the dot size. The charge for the desired shot size is determined through the interpolation of data points acquired through pump characterization.
FIGURE 6 shows the pump characterization showcasing the shot size versus charge relationship. Each of the charge values constitutes 21 data points collected through pump characterization over three weeks, equivalent to 21 days of continuous testing. The upper and lower specification limits are calculated around the desired shot size of 1.000mg per dot with a tolerance level of ±5%. The upper and lower specification limits are defined as 0.950 and 1.050mg per dot, respectively, on the figure.
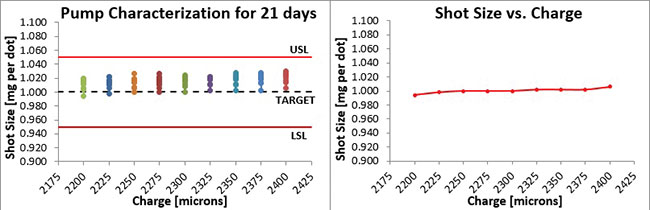
Figure 6. Pump characterization demonstrating shot size vs. charge relationship.
Pump characterization is repeatable within those 21 individual data points for each charge value. Shot size versus charge relationship is stable due to the offset on the adjustable bumper restricting the displacement volume. A complete stroke of the cylinder will dispense close to 0.835µliters of volume. Generally CSP/BGA underfills have specific gravity around 1.1 to 1.2, which amounts to 1mg of total weight during one complete stroke of the piston. During each stroke the displacement volume gets replenished with fresh material through the vertical chamber feed slots, thus avoiding any creation of dead volume spaces within the fluidic assembly. This prevents material from getting cured around the piston seal, avoiding malfunctioning of the valve that leads to failure during long hours of operation.
FIGURE 7 shows the process capability chart for different total weights ranging from 5 to 50mgs. The upper and lower specification limits are calculated around the target shot size of 1.000mg per dot with ±5% tolerance. Process capability is determined by comparing the width of process variation with the width of the specification limits. The process mean for all different total weights is close to the target (1.000), as shown in TABLE 1. For 5mg total weight, Pp = 1.414 indicates the specification interval is 1.414 times greater than the process range. The specification interval increases with the increase in the total weight. PPM < LSL (0.02) indicates 0.02 out of 1 million parts is less than the lower specification limit of 0.950mg per dot. PPM > LSL (0.90) indicates 0.90 out of 1 million parts exceeds the upper specification limit of 1.050mg per dot. A total of 1 part out of 1 million parts will have the total dispense volume out of specification for 5mg total weight.
There will be no part defects due to dispense volume for total weights greater than 5mgs.
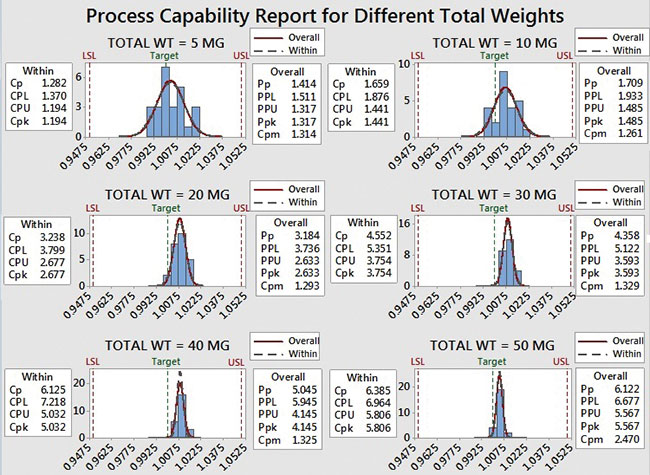
Figure 7. Process capability report for different total weights.
Table 1. Process Capability and Process Performance Data for Last Day Interval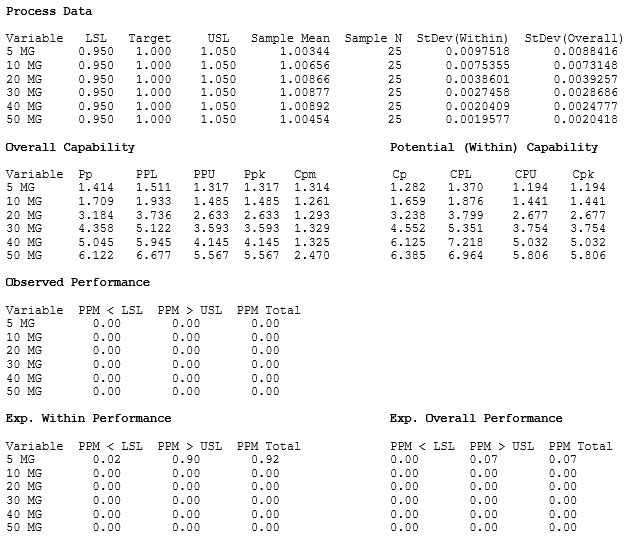
For the interpretation of process capability statistics, the data should approximately follow a normal distribution. The process performance index Ppk indicates whether the process will produce units within the tolerance limits. Ppk is an estimate of overall process capability determining variation within subgroups and between subgroups. Pp, on the other hand, ignores subgroups and considers the overall variation of the entire process. This overall variation accounts for the shift and drift that can occur between subgroups; therefore, it is useful in measuring capability over time. If the Pp value differs greatly from the Cp value, one concludes there is significant variation from one subgroup to another.
Cp indices recognize that the samples represent rational subgroups, which indicate how the process would perform if the shift and drift between subgroups could be eliminated. Therefore, it calculates process spread using within-subgroup variation. Process capability index Cpk measures how close the process is to the target and how consistent the process is around its average performance. An operator may be performing with minimum variation, but they can be away from their target toward one of the specification limits, which indicates lower Cpk, whereas Cp will be high. For both the shifts, high value of Cp and low value of Cpk indicate the process has a centering problem. A generally accepted minimum value for the indices is 1.33 to determine whether the process is capable, according to industry guidelines. Figure 7 shows both tails for all six distributions at different total weights fall inside the specification limits. Greater Ppk values indicate the process is capable in the long run for different total weights for tolerance level of ±5% at ±4 sigma capability.
Improved Maintenance and Pump Reliability
Streaming provides increased process capability and repeatability with stable throughput, as presented with the results above. The elimination of dead space in the pump enables consistent material replenishment that further reduces the need for preventive maintenance. Pumps were placed into a 24 x 7 HVM production site with the goal to operate the pump for at least 14 days without maintenance in a real manufacturing environment.
The low maintenance cycle target has been achieved and surpassed, thanks to two main factors. First, presence of nonreactive U-shaped cup seal providing excellent resistance to solvents and epoxies, preventing piston sticking to avoid pump failure. Second, the material within the displacement volume in the chamber gets replenished with fresh material through the vertical feed slots during each piston stroke. Pressure waves are created as the piston moves from the upstroke to the down stroke position, eliminating any creation of dead volume space within the fluidic/pump body. With these advancements to the fluidic body, the pumps have been able to run an underfill process with no issues; i.e., zero pump maintenance for more than 21 days in a 24 x 7 production line.
Summary
Streaming technology has brought a new level of robustness to the high-volume underfill process. With no z-axis motion required, streaming has mitigated all the effects from needles required in auger dispensing.
The parts’ wear-and-tear problem associated with jetting technology is not associated with the noncontact streaming technology, thus providing lower cost of ownership. Streaming also delivers fluid to the substrate through an unbreakable fluid stream, leading to higher mass transfer compared to small spherical dots with the jetting technology. Jetting underfill requires multiple cycles to put down the same volume of material compared to streaming, therefore requiring more time and yielding lower throughput during the production run. The U-shaped cup seal played an important role to avoid any piston sticking because of its nonreactive nature. The vertical feed slots help with proper flushing during each piston stroke, with fresh material within the chamber walls and a movable piston to overcome friction due to movable parts. All these design enhancements have helped achieve prolonged life of the fluidic/pump body, leading to 21 days of production with no maintenance.
With Cpk numbers greater than 2.0 for high-volume underfill applications, total weights ranging from 30 to 50mgs denote zero nonconforming parts per million at ±6 sigma capability during an average underfill production run. The streaming process widens the process window in such a manner that even if the process mean shifts by as much as ±1.5 sigma, the process will produce no more than 3.4 nonconforming parts per million.
References
1. S. Agarwal, “Low Volume Dispensing with High Speed Dispensers,” master’s thesis, State University of New York at Binghamton, December 2012.
2. Cookson Electronics, “STAYCHIP Capillary Underfill Encapsulants,” Technical Bulletin, accessed November 2015.
3. Glenn R. Blackwell, The Electronic Packaging Handbook, CRC Press, November 1999.
Ed.: This article was first published at IPC Apex Expo and is reprinted here with permission of the author.
is an applications engineer at ITW Electronics Assembly Equipment (itweae.com); sagarwal@itweae.com.


Press Releases
- Javad EMS Upgrades Through-Hole Soldering Capacity with New SEHO PowerWave System
- Sharpen Your Selective Soldering Skills with Kurtz Ersa's July VERSAFLOW 4/55 Training
- Omron Advances Inspection Technology with NVIDIA Omniverse and Metropolis
- Seika Machinery’s SMI 2026 Webinar Series Continues with Focus on PCB Cleaning Before Solder Paste Printing