

Current Issue
Implementing Good Test Coverage and Eliminating Escapes
Experimental data reveal a strong correlation between SPI and AXI.
Recent experiments involved AOI, AXI and ICT with production boards, with test data analyzed to determine potential test process improvements. According to results from three different complex assemblies (medium and low), different testing coverages are needed to ensure no manufacturing defects escaped. By reviewing the defective component/pin data, and analyzing them with Flextronics’ internal software, test coverage was optimized.
Because SPI and AOI were situated in front of AXI in the production line, it was efficient to use SPI and AOI to detect defects at an early stage. With SPI or AOI, it was possible to reduce AXI coverage while maintaining maximum testing coverage. To make the test method more effective, correlation studies with experiments were performed. We expected to see correlations between SPI-AOI, SPI-AXI, and AOI-AXI. To have more defect types and pins on the test boards, various stencil aperture percentages were used to ensure various defects for select components. The results showed good correlation between the testers, except for some defective pins at acceptable boundary condition levels. The data also indicate SPI volumes’ threshold that we need to adjust below 60%. The results are helpful for refining SPI, AOI and AXI programs.
The two AXI machines (AXIA and AXIB) studied were able to detect more than 90% defects for assemblies; however, image quality improvements are needed on the AXIB machine for critical packages such as PTHs or QFNs with insufficient solder.
Methodology. A laser-cut, 0.125mm thick stencil was used with Indium SMQ92J Type 3 solder paste. The solder was SnPb with a metal load of 90.25%, and the reflow peak temperature was 227.3oC.
Machine capability study. To identify assembly complexity level, a method introduced by Stig Oresjo1 was used. The Complexity Index (CI) number represented the assembly complexity level:
- CI < 50, low complexity.
- 125 > CI ≥ 50, medium complexity.
- CI ≥ 125, high complexity.
Eq. 1 is a calculation method of CI:
Complexity index = ((#C + #J)/100) * S * M * D (Eq. 1)
where:
#C = number of components
#J = number of joints
S = board sides (1 for double-sided, and ½ for single-sided board)
M = mix (1 for high mix, and ½ for low mix)
D = density ((joints/sq in)/100) or ((joints/sq cm) / 15.5)
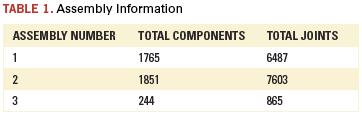
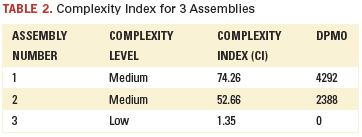
Table 1 shows data from the three assemblies for board size, total number of components and solder joints. Eq. 1 was used to calculate CI (Table 2). Based on the CI definition, assemblies #1 and #2 are medium complexity board, and assembly #3 is low complexity board.
Thirty boards for assembly #1 and #2 (medium complexity) and 22 boards for assembly #3 (low complexity) were tested at AOI, ICT1, AXIA, AXIB and ICT2. (AOI is Agilent SJ50 and ICT is Agilent 3070.) Boards were tested on the Agilent 3070 twice (ICT1, ICT2): ICT1 was used for testing ICT capabilities; real defective pins were not repaired until ICT2. All defective pins were recorded at each testing station. Test defect detection from each machine was compared, and the undetectable number of boards and pins on different machines and with different combined machines with three assemblies listed.
Optimizing test coverage. Flextronics’ internally developed CIS software (coverage improvement system) was used to analyze test data and obtain optimal test coverage. To eliminate escapes, we implemented all components and pins tested. For AXI testing: Case 1-100% coverage; Case 2 – BGA, QFN, and PTH; Case 3 – BGA, GFN, PTH and critical parts that had defects previously (history). AOI maintained 100% coverage, and ICT maintained regular coverage.
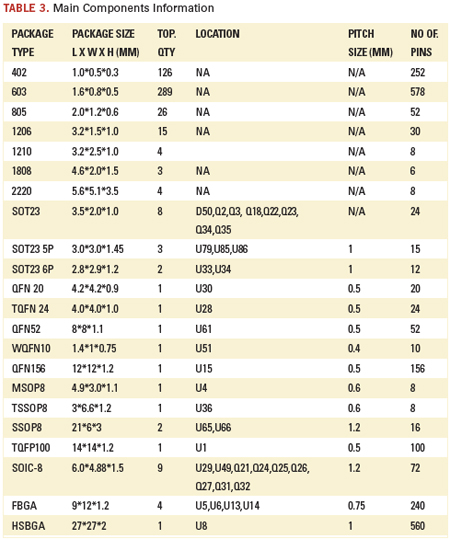
Correlation study. The experiment was done on assembly #1 (medium complexity). The board size is 265 x 175.5mm and 1.6mm thick with eight layers. Table 3 lists the main component information.
CyberOptics SE300, Agilent SJ50, AXIA and AXIB were used for SPI, AOI and AXI testing with these three defective boards. We collected test results (attribute and some measurement data and defective images) from the machines. We had more than 38,000 data points for correlation studies between SPI-AOI, SPI-AXIA, SPI-AXIB and AXIA-AXIB. SPI, AOI, AXIA and AXIB testing results were compared: SPI-AOI, SPI-AXIA, SPI- AXIB, and AXIA-AXIB. Fail or pass results showed correlation at SPI-AOI, SPI-AXIA, SPI- AXIB and AXIA-AXIB; the results with fail-pass or pass-fail have no correlation at SPI-AOI, SPI-AXIA, SPI-AXIB and AXIA-AXIB.
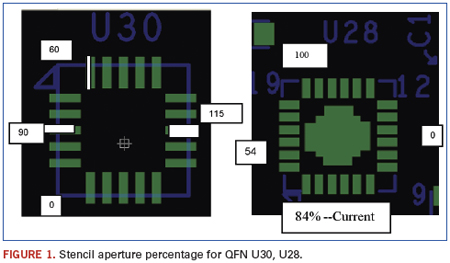
Package styles selected for the experiment included BGA, QFN, SOT, resistor network, 0402 capacitor and 0402 resister. Different stencil aperture designs were used to create different defective types, including open, short, insufficient and misalignment. Stencil pins of each package had two to five various stencil aperture percentages of CAD data: 0%, 30%, 40%, 50%, 60%, 80%, 90%, 100%, 110%, 120% and 150%. Figure 1 shows two QFN stencil aperture percentages.
Results and Discussion
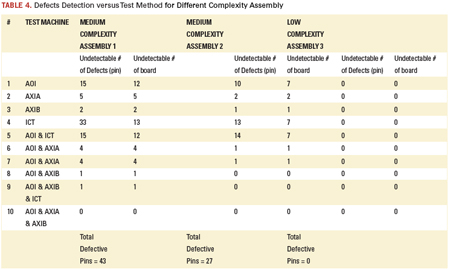
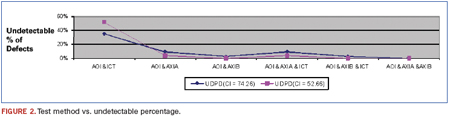
Machines’ capability study. Test data came directly from the SMT manufacturing line. The total real defects number was 43, 27 and 0 for Assembly #1, #2 and #3, respectively. The tester detection percentage is different with different complex assemblies. Table 4 lists different testing methods to analyze data for medium #1, medium #2 and low complex boards – the same method for all the boards. Defective pins and boards escaped are listed for different test methods. No escapes were observed with AOI and AXI combination testing for medium-complexity assemblies. Figure 2 shows the test method versus undetectable percentage. It appears AOI and AXI can cover ICT detection for these two assemblies. For low-complexity assembly, there were zero defects. Based on the data, AOI shows good defect detection (35% - 37% of total defects) for both medium assemblies. ICT shows better detection (48% of total defects) for Assembly #2.
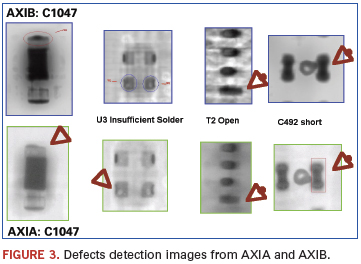
Both AXI machines (AXIA and AXIB) had effective detectable capabilities. Figure 3 shows x-ray images of defective pins (insufficient solder, open, short) from AXIA (bottom row) and AXIB (top row).
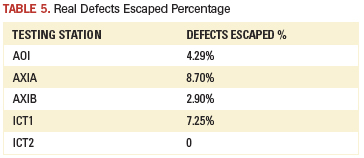
Different test machines had different test coverage percentages and defects detection. Table 5 lists the real defects escaped percentages from each machine. The definition of real defects escaped percentage is the total number of real defects escaped from the tester divided by the total number of real defects that tested at the machine. AOI and AXIB had less than 5% escape; and AXIA and ICT1 have escaped 8.7% and 7.25%, respectively. These results are directly from our SMT manufacturing line. The data represented AOI, AXI and ICT machine performance.
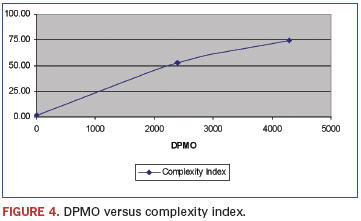
The Complexity Index is 74.26, 52.66 and 1.35 for assembly number #1, #2 and #3 respectively. The defects per million opportunities2 (DPMO) is 4292, 2388 and 0 for the assemblies based on total real defects numbers of 43, 27 and 0, respectively. The larger the CI is, the larger the DPMO is (Figure 4). (The authors plan to have more data points for DPMO vs. Complexity Index on the graph, and expect DPMO with CI number for new products. This means we may predict DPMO for a new assembly if we have more data points for the graph.)
Optimization Test Coverage
CIS automatically provided test component coverage, test time and testing percentage, and duplicated test component percentage after input of CAD data and each machine’s test data.
As mentioned, there were three case studies. The testing time of three assemblies for test machine versus case study is listed in Table 6. The AXI testing time can be significantly reduced, with Cases # 2 and #3 showing reduced percentages for duplicated testing coverage. However, there was little change of Duplicated Testing Percentage between Case #2 and #3, but we are much more confident with the escapes per the Case #3 method because we tested all defective locations (component/pin), which were shown for the past several months from our production SMT lines.
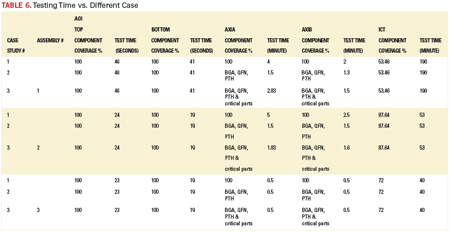
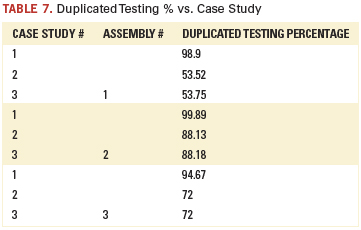
Table 7 shows duplicated testing percentage versus case study. Testing has no value for products; however, testing data can be used to improve the SMT process and resolve issues at the beginning stages. We also use historical testing data for reduced duplicated testing percentage for testing optimization. Based on our studies, there is room for reducing test duplicated testing percentage.
Correlation Study
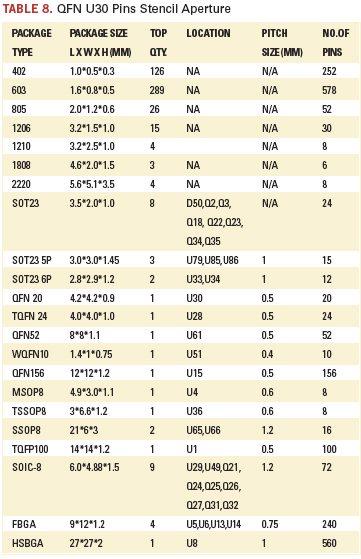
We had different stencil apertures with different packages to create more defects for the study.3 Table 8 lists QFN U30 pins stencil aperture. The second column is our planed stencil aperture percentage for each pin; the third and fourth columns are stencil length and width; and the last column is the actual area percentage for the stencil aperture area based on calculation.
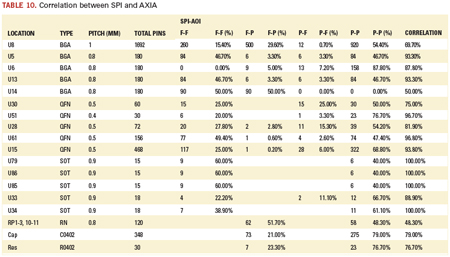
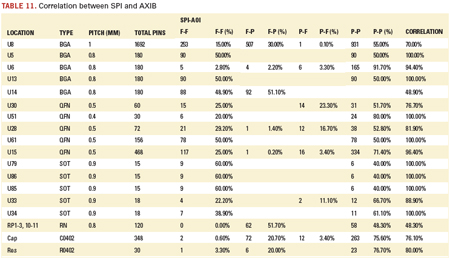
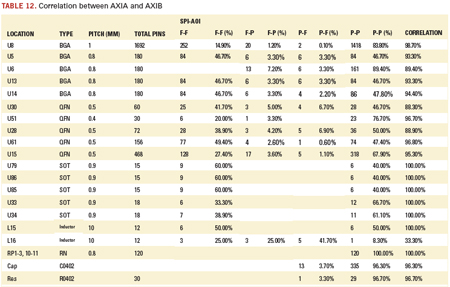
The correlation results of SPI-AOI, SPI-AXIA, SPI-AXIB, and AXIA-AXIB are shown in Tables 9 to 12, respectively. The component location, package type, pitch size, and total number of pins are listed in the first, second, third and fourth column of each table. F-F, F-P, P-F, and P-P stand for Fail-Fail, Fail-Pass, Pass-Fail, and Pass-Pass for two machines’ attribute results: Fail-Fail and Pass-Pass mean two machines have the same testing results, and Fail-Pass means the first machine testing data failed for the pin, and the other machine passed the same pin.
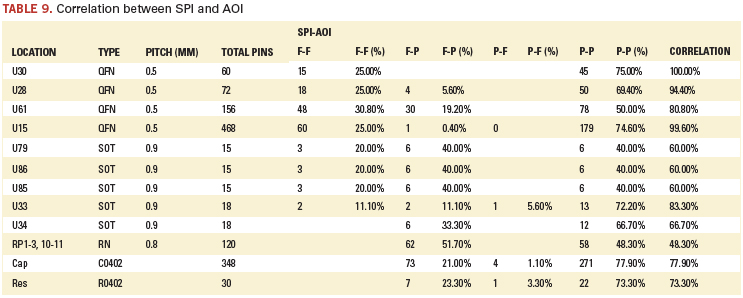
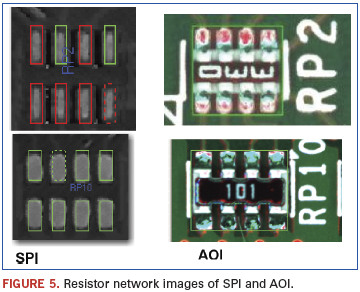
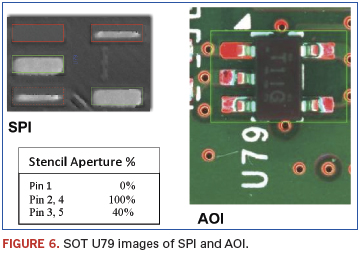
SPI and AOI have correlation ≥60% for most packages, except for the resistor network package because AOI passed all pins with 63% stencil apertures, and SPI only passed three pins due to the SPI threshold as volume 60%. In Figure 5, the top is RP 2, which has 63% stencil aperture: SPI images showed insufficient, and AOI images closed to boundary; bottom is RP10, which has 114% stencil aperture which SPI and AOI passed them. The SPI and AOI images for SOT U79 are as shown in Figure 6. U79, U85 and U86 are the same SOT packages. The pins with 40% stencil aperture failed at SPI, but AOI passed all these pins. The question becomes, how do we set the SPI and AOI threshold? More studies of SPI and AOI are ongoing at our Shanghai and Suzhou sites.4-5
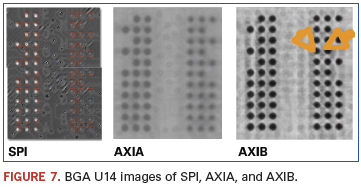
In Table 10 and 11, we have good correlation for SPI-AXIA and SPI-AXIB for most packages, except for BGA U14 and resistor network components RP 1-3. BGA U14 has 60 pins with 0.8mm pitch size. The stencil aperture is 33% and 81% as CAD data (pad size). Figure 7 listed its images for SPI, AXIA, and AXIB. SPI failed all pins, both with 33% (pin on right side) and 81% (pin on left side) stencil apertures due to solder volume less than 60%. Both AXIA and AXIB passed pins with stencil aperture of 81%, and AXIB passed extra two pins (orange color arrow) with 33%.
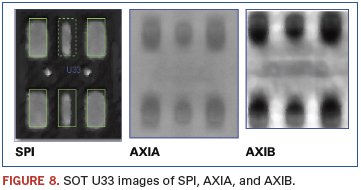
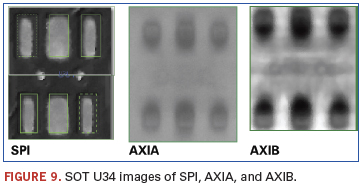
Both U33 and U34 are the same SOT, which has six pins, and its pitch size is 0.9mm and pad size is 0.6mm x 1.2mm. The U33 has two pins with 40% stencil aperture (Figure 8); U34 has four pins with 50% aperture (Figure 9), and the rest of the pins have 100% stencil aperture. SPI passed two pins with 40% open aperture because its volume passed 60%; however, both AXIA and AXIB failed them as insufficient – and they clearly have insufficient solder based on AXI images. U34, SPI, AXIA and AXIB passed four pins that are boundary (50% stencil aperture) (Figure 9).
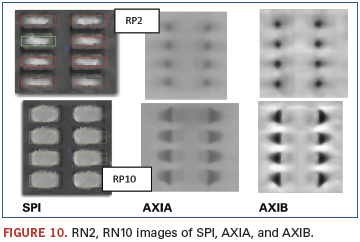
The resistor network (RN) has eight pins of 0.5mm pitch and 0.3 x 0.9mm pad size. In Figure 10, PR2 has 63% aperture open, and RP10 has 114% aperture open. AXI passed pins with 63% stencil aperture; however, SPI failed these pins that are at boundary. SPI, AXIA, and AXIB passed all pins with 114% stencil aperture.
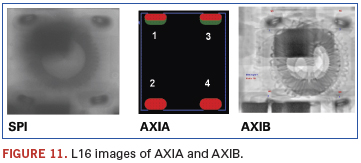
We used two AXI machines, AXIA and AXIB, for this correlation study. We have very good correlation (>88%) for all packages, except inductor L16. L16 had four pins with pad size 2.3 x 4.3mm. Pin #1 and pin #3 had 60% stencil apertures, and pin #2 and pin #4 had 100% stencil aperture. Figure 11 shows AXIA and AXIB images for board #1. AXIA testing data indicated pin #1 and pin #3 as failed; however, AXIB passed pin #3. From the AXI images (Figure 11), there is no obvious difference between pins with 60% and 100% stencil aperture. This is the reason for poor correlation for L16.
The data show good correlation between SPI-AOI, SPI-AXIA, SPI-AXIB and AXIA-AXIB, except for some pins with stencil aperture for boundary solder quality. The result is good information for optimized SPI, AOI, AXI programming threshold settings.
Conclusions
1. There is room to reduce testing coverage by studying detectable defects and testing yield from testing machines.
2. Test strategy (method) depends on board complexity, tester capabilities and product yields.
3. Test optimization is the best balance between no potential escapes and minimum test coverage.
4. A DPMO prediction can be made for a new assembly program when there are more data points on the graph (DPMO vs. Complexity Index).
5. AXIA and AXIB correlated very well with their testing data. They showed the same level of defect detection performance in the SMT lines.
6. It is possible to reduce AOI testing with SPI; it is also good to reduce AXI by using SPI and AOI. The experimental data show very good correlations between SPI and AXIA, and SPI and AXIB.
7. There are potential time savings for SPI, AOI and AXI programming with the correlation data/results to change SPI, AOI and AXI threshold settings.
References
1. Stig Oresjo, “When to Use AOI, When to Use AXI, and When to Use Both,” Nepcon West Proceedings, December 2002.
2. IPC-7912A, End-Item DPMO for Printed Circuit Board Assemblies, January 2004.
3. Zhen (Jane) Feng, Alex Garcia, Scott Kingery, Murad Kurwa, Walid Meliane, and Thomas Munnerlyn “Lead-free: Defects with SPI & AXI”, SMT, March 2007.
4. Johnny Chen, R Sivam V Rajoo, Marco Zhao, Wei Wen, Golden Xu, Ace Ning, Michael Xie, An Qi Zhao, Wei Bing Qian, Fuqing Li, Ken Wong, Zhen (Jane) Feng Ph. D., and Murad Kurwa, “Method of Determing Solder Paste Inspection Tolerance Settings,” SMTAI 2011, October 2011.
5. An Qi Zhao, King Zhang, Wei Bing Qian, Wilson Ye, Andrew Ho, Zhen (Jane) Feng, Murad Kurwa, “How to Improve AOI Application in SMT Production line,” APEX Poster, April 2011.
Acknowledgments
The authors wish to acknowledge Flextronics’ engineering and production teams at Shanghai, China, and vendor “AXIB’s” engineering support team. Also Wilson Ye, Wei Bing Qian, King Zhang, Jacky Bi, Huajiong Dong, Hong Qiang Xie, Bao Jun Wei, Michael Xie, Renie Zhao, Jiyang Zhang, R Sivan V Rajoo, KA Leow, KarHwee Ang, David Geiger, Eleven Yang, and Stephen Chang.
Ed.: This article was first presented at IPC Apex in April 2011 and is reprinted here with permission of the authors.


Press Releases
- Seika Machinery’s SMI 2026 Webinar Series Continues with Focus on PCB Cleaning Before Solder Paste Printing
- Forwessun Expands Testing Capabilities through Strategic TRI Alliance
- Federal Electronics Expands Advanced Manufacturing Capabilities to Support Military and Aerospace Cable Assembly and Wire Harness Programs
- Altus Continues Irish Growth with Expansion of Engineering Team