

The Effect of Placement Yield on Rework Costs
A benchmark study of cost as a function of various yield rates and line capacity.
Calculating rework and scrap cost is relatively straightforward, provided the production line’s first pass yield (FPY) is known. The cost of low yield is simply the difference in rework and scrap between the manufacturer’s production line and that of a benchmark line. The benchmark figure for stencil printing is around 10 dpm (defects per million), and that for a pick-and-place machine is now 5 dpm. Allowing for defects from PCB manufacture and reflow soldering, that gives a whole-line benchmark of below 30 dpm.
Compared with a typical whole-line defect level in the industry as a whole of between 50 and 100 dpm (just for standard components – the dpm for miniature components such as 01005 types can be 200 or more), that might seem wildly optimistic. The Czech plant of automotive equipment manufacturer Alps Electric steadily attains a level of around 25 dpm, though, for an average of 1 to 2 billion components per year.
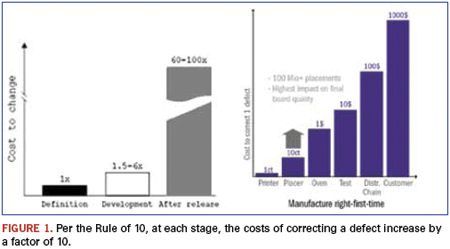
The costs of quality can easily outweigh labor costs. So, even in countries with low wage costs, the savings can be huge. For a typical board with, say, 1,000 components, a whole line quality of 25 dpm gives a benchmark FPY of 97.5%. A line producing 100 boards/hr. (100,000 components/hr.) will need one rework station. Assuming a typical three-shift operation, three operators will be needed for rework. In practice, inline repair will find 90% of all defects. The remaining 10% will be detected at a later stage, increasing repair costs by a factor of 101 (the Rule of 10) at each stage (Figure 1).
Annual labor costs average $2,800 to $4,200 in Southeast Asia, $7,000 in Mexico and Eastern Europe, and $40,000 to $65,000 elsewhere. That gives total repair costs per 25 dpm line of $35,000 to $410,000 per year. By contrast, a typical 100 dpm production line would have a yield of 90% and would need two rework stations with repair costs of up to $625,000. And, because defects often come in batches, the lower the yield, the more random the effects and less predictable the output. Rework lines can be underworked one day and stacked to overflowing the next.
The principle of Six-Sigma quality is to keep processes not just within specification limits – what a customer asks for – but within control limits that are repeatedly well inside specification limits (high process capability). That means processes can drift, but still produce good output while faults are being corrected. This is basic quality improvement theory, and is also critical to successful (and profitable) electronics manufacture.
Reaching benchmark performance means optimizing each of the three major surface-mount processes: stencil printing, pick-and-place, and reflow soldering. Solder paste printing needs to select the correct stencils, apertures and printing parameters for components being used, with regular monitoring of stencil cleaning and paste replenishment. Each process step of the pick-and-place machine needs to be monitored and working well within specifications. Reflow soldering needs the correct reflow temperature profile with accurate process control. There are several key signs of manufacturing processes going out of control, and they tend to fall into distinct classes and with distinct causes. Identifying those signs helps trace faults quickly to bring the process back into control.
In practice, the major influence on production line quality is the pick-and-place machine. And the major quality figure for a pick-and-place machine is the defects per million level, since that reveals the expected yield.
Calculating Yield
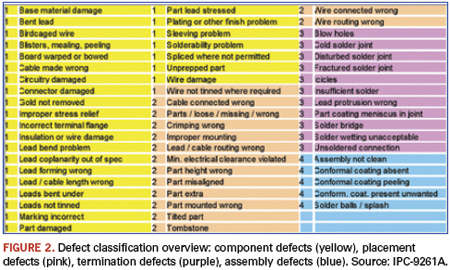
Three related IPC documents (IPC-A-610D, IPC-9261A and IPC-7912A) describe how to calculate yields for a particular board on a particular production line. The standards distinguish the types of SMT defects (Figure 2), and count the number of possible opportunities for defects on each board, which depends primarily on the board’s complexity.
Each component can itself be defective, can be incorrectly placed, can have either of its terminations incorrectly soldered, or (sometimes) have an incorrect process step like a missing conformal coating. Each of those is counted as a single defect opportunity. So a chip component can be cracked, or incorrectly placed, or have one of its two terminations incorrectly soldered, which equals four defect opportunities. Similarly, a QFP52 has a defect opportunity of 54. Adding all the individual component defect opportunities gives a figure for the whole board, and this is normally dominated by the termination count.
The next step is to predict the actual number of defects that a given production line will produce for a board of a particular complexity. That needs a historic value for the actual DPMO (defects per million opportunities) for the line, which any manufacturer serious about improving production quality will track. The DPMO for a board is simply 106 times the total number of actual defects over the total number of defect opportunities. More than anything else, the FPY determines the overall cost of placement. High FPY means low scrap and rework costs, and high return on investment.
The yield is then given by
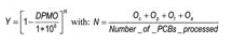
where Oc, Op, Ot and Oa (Ocomponent, Oplacement, Oterminations, Oassembly) are the defect opportunities. On a board with 1,000 defect opportunities, a single defective placement on 1000 boards would mean a DPMO of 1 and a yield of (0.999999)1000, so 0.999 or 99.9%. A typical board will actually have many more defect opportunities: Table 1 shows a typical board with around 1,000 components having nearly 6,500 defect opportunities.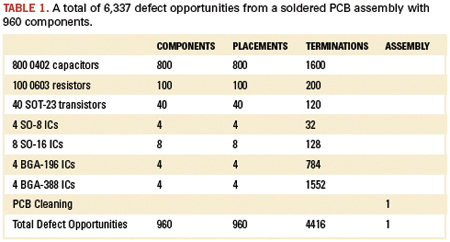
Yield can usefully be calculated over the year. Given 6,000 productive hours in a year and a line cycle time of 40 seconds, that means nearly 3.5 billion defect opportunities a year (540,000*6,337 = 3,421,980,000). With 15,000 defects a year, the DPMO is just over 4 (106*15,000/3,421,980,000= 4.38). That gives a yield of Y = 97.26 % over the year.
Figure 3 shows how yield depends on the number of defect opportunities for various DPMO figures. Every colored line indicates a certain DPMO level. Depending on the quality of the process, the DPMO figure shows whether defect opportunities are converted into actual defects. With a low DPMO, the yield drops slowly and almost linearly with the number of defect opportunities. So, yield remains good for even complex boards. The higher the DPMO, the more steeply the yield drops to zero.
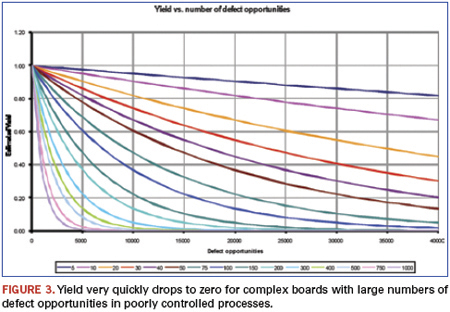
A manufacturer will actually have a window of defect opportunities. Automotive boards, for example, have from around 100 components (entry level) up to 600 components (top of range). Around 96% are resistors and capacitors (defect opportunity of four each), and up to 4% are ICs. ICs mainly include QFP and SO types, with a few BGAs of up to 300 I/Os, giving a total average defect opportunity of, say, five. That gives a total of between 2,000 and 12,000 defect opportunities per board (four-fold board).
Different applications have different defect opportunity windows. Automotive boards tend to have low component counts (but the cost of a defect in an automotive board can be very expensive). For mobile phones and (particularly) communications and server boards, the window shifts to the right. The window for mobile/smartphones is typically between 6,000 and 20,000, and that for complex communications and server boards from 25,000 to 60,000. For all products, the yield drops most for the larger, more expensive top-of-line products. The cost of rework correspondingly increases.
Calculating Rework
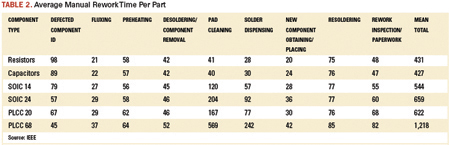
The first-pass yield gives the percentage of boards with good quality, so (1-FPY) gives the percentage of boards needing repair (rework). The average repair time per SMT defect (Table 2)1 gives the related time for rework. For boards with an average of 90% resistors and capacitors, the weighted average per defect is 540 sec., or 9 min.
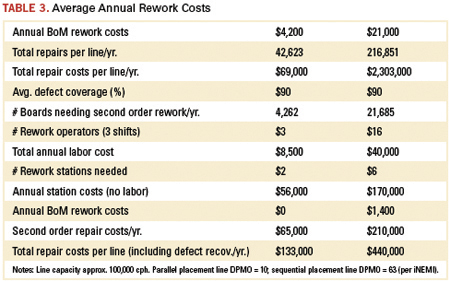
The major determining factor for yield, and therefore, rework costs, is the placement technique. Sequential placement dominates the industry, with machines usually having one or two heads working at very high speeds. Parallel placement machines instead have multiple placement heads (up to 20), so the individual heads have much more time to settle before placing the component. So, for the same overall placement rate, parallel placement machines have a much steadier and more controlled placement action. Even in India and China, the difference in rework for a parallel over a sequential placement machine per line can exceed $300,000 (Table 3).
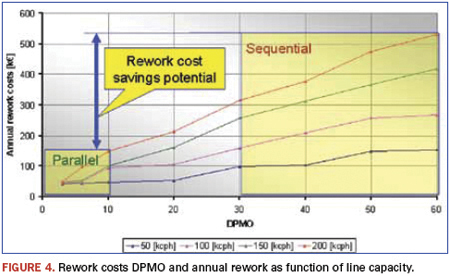
Actual savings depend on line capacity, and are almost double for a line placing 200,000 cph vs. one placing 100,000 cph (Figure 4). The difference between parallel (even at 10 dpm) and sequential placement (at 60 dpm) producing 10 million phones per year in China with 250 SMDs per phone would be around $1.3 million per year. And factories can have 50 or 100 lines.
Rework costs are thus a factor of 3.5 lower for benchmark pick-and-place machine lines, and that is just in the low-wage countries. In Germany they can rise to $1.2 million per line per year for automotive engine controllers (typically 340 components per circuit, six circuits per board, around 10,000 defect opportunities per board and a line capacity of 130,000 cph). That permits manufacturers to keep their production lines in the West, saving on distribution and logistics costs, while retaining all the advantages of short supply lines.
Even in the best-controlled processes, defects tend to come in groups. In well-controlled processes, though, the reasons for the defects can be quickly found and corrected. Actually finding the defects, however, is becoming more difficult.
No quality inspection technology provides 100% reliable coverage. Research by Nokia and the University of Oulu in Finland shows most technologies provide around 90% coverage, leaving 10% of all defects undetected. Finding detects therefore requires a combination of AXI, ICT and AOI technologies. Even then, though, some defects will slip through. This demonstrates a basic quality principle: You can’t inspect quality into device, but instead have to improve the process.
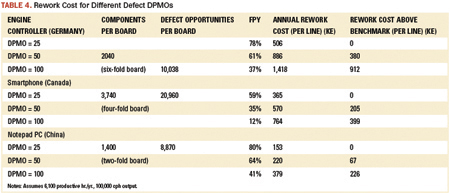
State-of-the-art screen printers offer process quality below 10 defects per million components. The industry DPMO for stencil printers is above 25 dpm. For pick-and-place machines, it is around 25 dpm, with the worst giving 50 or more. Compared with a whole-line benchmark figure of 25 dpm, typical and poor figures would be 50 and 100, respectively. Per Table 4, a complex smartphone produced on a whole-line DPMO of 25 would give a 59% yield. For a DPMO of 50, the yield drops below 40%, and for 100, it is an impossibly low 12%.
These are the visible costs. As the Rule of 10 suggests, detecting a defect at final test costs 10 times more than detecting it immediately after placement, 10 times more than that at the retailer, and 10 times more than that in the shop.
And recent quality problems in well-known car brands illustrate another basic rule of quality improvement: Faults that escape to the customer are the most expensive of all – in damage to reputation.
References
1. IEEE Transactions on Electronics Packaging Manufacturing, vol. 26, no. 2, April 2003.
2. Dr. David M. Anderson, “Design for Manufacturability and Concurrent Engineering,” CIM Press 2008, ISBN 1-878072-23-4.
Sjef van Gastel is manager of advanced development, Assembléon (assembleon.com); sjef.van.gastel@assembleon.com.


Press Releases
- Kurtz Ersa Partners with E-tronix for Sales in Illinois and Wisconsin
- XLR8 EMS Welcomes Raul Jorge Lopez Jr. as Director of Program Management and Procurement
- Koh Young America Promotes Ramiro Mora to Lead Service and Applications in Mexico and South America
- ViTrox Americas Welcomes Huy Pham as Technical Support Engineer