

Measuring Reflow Oven Performance (or Mind Your U2RZY3Cs)
A thermal processing expert’s take on which tests are ideal for comparisons.
I get asked how I would evaluate the performance of a reflow oven because of my experience with oven testing and participation in the IPC Reflow Oven Process Subcommittee. Some of the questions are basic, such as “Which oven should I purchase?” “Is this new oven as good as the older one?” or “Will it work with my boards or specific process requirements?” Other questions are more complicated: “Will this oven help me produce an acceptable profile with our heavy board?” or “Is this oven better than XYZ’s reflow oven?”
These questions got me thinking about establishing a guideline to compare the performance of reflow ovens. I use the word “compare” because oven evaluations can be different for each company due to specific needs and requirements. Years ago, I was involved with an IPC attempt to develop a reflow oven standard that included a proprietary test board, a proprietary thermal profiler and a defined thermal profile. The goal was to identify a basic way to “certify” that a reflow oven could produce an acceptable thermal profile, but it had little relevance to a company’s actual manufacturing requirements.
Proprietary test vehicles are not new. Several OEMs have developed various test vehicles with a varying number of possible connections. Each has its place, but in my experience they are only partially helpful in evaluating the performance of a reflow oven and are best for identifying if an oven thermal profile is changing over time.
Thus, based on hundreds of solder reflow trials and years of thermal processing experience, I have documented the tests that I would conduct when comparing the performance of various reflow ovens. The list of important items became U2RZY3Cs. It does not make statements about minimum performance specifications, but outlines a way to compare the performance of reflow ovens and identify which one is best for a specific profile requirement.
Determining the Target Profiles
The first step is to identify the ovens you want to evaluate. This is usually based on the oven manufacturer’s reputation, your experience, or the recommendation of others. Once the ovens to evaluate are identified, determine the target profile or profiles for the trials. In most instances this should be a ramp-to-peak profile that simulates a Pb-free solder profile and a ramp-soak-peak profile as is used with tin-lead solder. Table 1 suggests generic target profiles, but any profile targets desired can be used and can include the time within 5°C of the peak temperature specified by some paste companies.
Table 1. Generic Profiles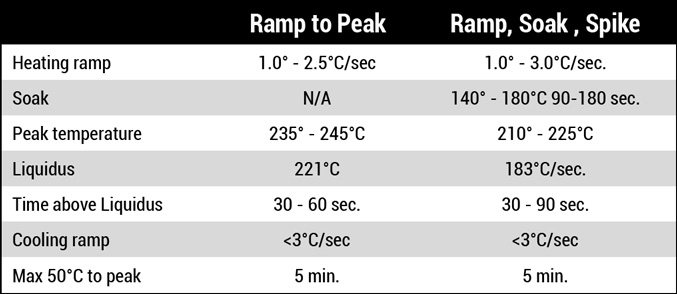
Next, baseline recipes that include zone set points and belt speed (Au: see note about fan speed) for each of the ovens under test should be produced with a simple board. That board could be an aluminum plate or FR-4 board with three to four thermocouples (TCs) firmly attached in various places, or a real board that can be easily duplicated over an extended time. I prefer a 12" x 12" x 0.060" (300 x 300 x 1.5mm) aluminum board aluminum plate with the TC junctions under small washers and screws to provide consistent contact and long life. A typical product or FR-4 can be used, however, provided it can be easily duplicated in the event it is damaged or destroyed. An easily duplicated board is important in order to evaluate other ovens in the future.
(Note: Some reflow ovens can set or control the speed of fans in each zone. This affects the velocity of the heated air and impacts the board and heat transfer efficiency. Typically, the highest velocity is used because it has the highest heat transfer rate and produces the best temperature uniformity. In some cases, however, the high velocity gas will move small components in the initial heating zones and is detrimental to production. If this is an issue, conduct the trials with the lower fan speeds [convection rate] to understand what is best for the application.)
Now, let’s look at U2RZY3Cs.
U (uniformity). The two types of temperature uniformity are cross-belt and longitudinal (along the oven length).
Cross-belt temperature uniformity compares the peak temperature of numerous TCs placed across the width of a board as it passes through a heated oven. I like a 6" x 18" x 0.130" metal-clad FR-4 uniformity board that one reflow oven manufacturer uses. It has six TCs evenly spaced across the width of the board, with the end TCs set 0.5" from the left and right edges. (It may also be 24", 8" or 6" wide for extra wide or multiple lane ovens.) The distance from the edge is important because in many cases components are close to the edges of the board where edge rails exist and we want to include measurements in those areas.
Alternately, a cross-belt uniformity board may be made of aluminum or FR-4 using the small screw and washer attachment procedure outlined above. A word of caution: Ensure the TCs come from a single manufacturing lot so they have the same relative accuracy.1 Processing the board through the oven with both the ramp-to-peak and ramp, soak, spike recipes previously developed will provide the cross-belt data. If the cross-belt uniformity seems large, the board may be swapped left to right to determine if the difference is the oven or the TCs.
Longitudinal is an often-overlooked uniformity measurement. It measures the temperature differential as the board travels along the length of the oven. Since there is a difference in the time the various positions of the board are in the heat, it limits the evaluations to the heating rates, time between specific temperatures, and peak temperature. In this case, I prefer an 18" x 18" x 0.130" board with nine TCs (aluminum or FR-4) set 0.5" from the edges (like the cross-belt uniformity board) and a few in the center, as in Figure 1A, but a simple board such as in Figure 1B will work. Smaller or larger boards can be used if they are more appropriate for the specific product or the oven being tested. The TC mounting procedure should be the same as the cross-belt board, and data from both recipes should be obtained. Again, the board can be rotated 180° and run through the oven if the accuracy of the TCs is questioned.
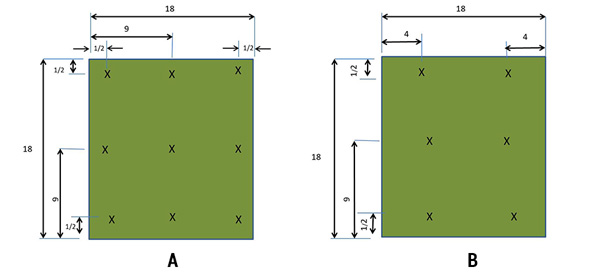
Figure 1. Sample boards for measuring temperature differential. 1A is preferred because of its greater number of TCs.
R (repeatability). Next is the first of the two Rs: repeatability. Hour to hour, day to day, week to week, month to month, thermal profile repeatability is important in any SMT manufacturing facility. Trials like this could take a long time – weeks and months – to determine if an oven has good repeatability. A shortcut is needed. One way is to run a board through the oven multiple times and calculate the oven CpK or PpK as outlined in IPC-7801, “Reflow Oven Process Control Standard,”2 SMTA classes such as those taught by Dr. Ron Lasky and Jim Hall, or other sources. I like to cycle the temperature of the oven between the two recipes multiple times over a couple days while doing other tests to obtain repeatability data. The profiler should follow the board by a minimum of one zone so it does not affect the data.
In discussions of repeatability, it is good to remember edge rail position repeatability. This is typically performed by cycling the edge rails from the maximum and minimum positions to an intermediate setting and taking measurements at numerous positions along the length of the oven. This also allows monitoring of the rail parallelism. An elaborate fixture with dial indicators can be designed but if a makeshift device is used, be sure to measure the distance perpendicular to the edge rail and not skewed at an angle.
R (response). The thermal profile of a single board going through an oven is only part of the repeatability performance of a reflow oven. Some oven manufacturers have “high response” systems that respond to board loading and others have TCs mounted inside the chamber to maintain consistent gas temperatures. This test identifies the effect of load changes on boards in the process line of each oven.
The method is to run multiple boards in succession through the oven while it is at a stable temperature and record the temperatures of each board. On the surface it is impractical to put TCs on five, six or eight boards to measure the response of an oven during a single run but we can do it with multiple runs by placing the test board in different locations starting with position 1, then 2, etc. and comparing the results. It is best to use heavy boards so the oven must respond to the load. I usually like to run the boards that match the 18" x 18" x 0.130" instrumented board used in the repeatability trial with one board spacing between them, with the profiler following by at least one zone. Other sized boards may be used, however, with the spacing increased or decreased if desired. I believe that one should run the test board in at least six locations for this trial, but I prefer eight.
Z (zone temperature separation). Zone separation is especially important with obtaining the older tin-lead ramp – soak – spike profiles but is becoming increasingly important as soaks are being specified for Pb-free solders. Zone separation is driven by gas flows in the oven and oven insulation. A highly efficient oven can be the nemesis of good zone separation because the lower temperature zone has limited ways to give up its heat. Additionally, zone separation is affected by the temperature of the preceding zones. Therefore, there are second and third order effects to consider when testing. A simple solution is to run a series of tests where the maximum zone separation is determined by turning the power off in the lower temperature zone while the other zones are at temperature and seeing the resulting stable temperature. As mentioned, it is important to evaluate the second order effects.
The method we found to be successful is to set the final one or two zones of an oven at a high temperature, turn the power off in the previous zone, and set the next zones at various lower temperatures. Once the oven temperatures stabilize, you can record the temperature of the zone with no power. The choice of which zone to power off depends on the length of the oven. Table 2 shows an example of set points for determining the zone 8 differential capability of a 10-zone oven. Adjustments can be made for more or fewer zones and different zones but be careful because some ovens have rail hangers that can affect the results.
Table 2. Set Points for Determining Differential Capability of Zone 8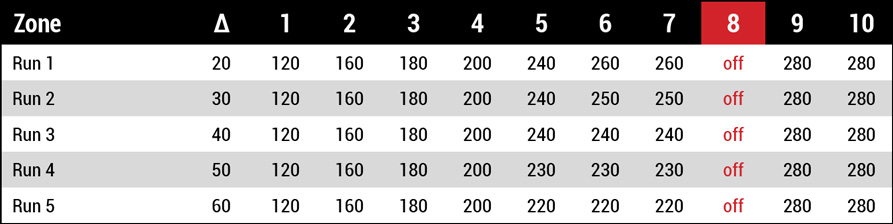
The results can be affected by the gas flows and belt speed, so I usually set the gas input at the recommended levels for nitrogen and the belt speed at the tin-lead profile speed for the oven being tested. Note: This evaluates the zone temperature separation of the oven and does not show what happens when a board is going through the oven.
Y (your product and profile). It does little good to purchase an oven that is the best in each category listed above if it doesn’t produce good product for the desired application. Therefore, it is important to prove repeatability and profile capability for your profile target with your boards. This may sound simple but at times requirements call for a maximum temperature for an individual component, or a component is shielded by something that only a specialized oven or process variable will satisfy.
If this is the case, running the “tough” or “nearly impossible” board with your profile requirements is the only way to ensure the oven is right for the specific application. Once an acceptable recipe for the board is established, conducting a repeatability study as mentioned in the R (repeatability) section is important.
The 3Cs (changeover time). Changeover time between recipes is important in many factories that have short production runs. Most ovens heat significantly faster than they cool, so the test needs to be performed with both the cooler-to-hotter and hotter-to-cooler recipes. I use the Pb-free and tin-lead recipes that were established in the first test for each oven so there is some common thread among tests. Two issues to be aware of:
- The oven control system may indicate it is ready, but that doesn’t mean the temperatures or set points have been reached. Most ovens have a “ready condition” tolerance that turns on the ready light.
- In some cases it takes a few minutes or more for the temperature in the oven to stabilize even if it has reached the set point temperature because of different thermocouple locations. Determining the stable condition is hard; the only reasonable method is to identify when all zones have consistently met the set point and the power is stable. As mentioned, this should be done going from the hottest-to-coldest and coldest-to-hottest recipe.
Some users consider startup time a form of changeover, so the same rules apply as if the first recipe is from a cold oven to attaining set points for both Pb-free and tin-lead settings.
C (consumption). This is part of the cost of ownership equation that includes air/nitrogen and electricity.
Electricity consumption can be divided into two parts: startup and operating power. These depend on the recipe (Pb-free or tin-lead), gas flow and oven startup procedure. Numerous devices record electricity usage. Some oven manufacturers stage the zone startup or limit the heating rate to lower the startup power required, but this can affect startup time. Additionally, nitrogen ovens may require a longer time to obtain the oxygen levels required than it takes to reach temperature.
C (cost). Often the purchasing department wants an oven that has the lowest price without understanding that the real issue is cost of ownership over the long run. Items such as nitrogen consumption, power, spare parts, ease of maintenance, options, and reliability are more important than the initial price. Some of these have been discussed previously but their importance should not be overlooked. It is somewhat easy to identify nitrogen and power consumption but hard to confirm aspects such as mean time to failure or the long-term availability of parts during a limited trial. Thus, we must rely on a company’s reputation, professionalism, internal system, and word. That brings us to the last item:
s (service). All mechanical items fail sooner or later. What happens when you have a problem? Having an inoperative oven for hours, days or months is not good. Does the oven supplier have immediate phone support and service technicians that are quickly available? Can the company help with process issues if you have a new product with difficult thermal specifications? Can they assist if you suddenly have a process issue?
In conclusion, it is possible to add items to the U2RZY3Cs outline but it covers many of the items I would consider when evaluating reflow ovens.
References
- Fred Dimock, “Thermal Degradation of Type K Thermocouples at 850° and 250°C,” IMAPS New England Symposium, May 7, 2013.
- IPC-7801, “Reflow Oven Process Control Standard,” April 2015.
Bibliography
- Fred Dimock, “Maximizing Process Control with Controlled Convection Rates,” Global SMT & Packaging, 4, no. 1, December 2003/January 2004.
- Fred Dimock, “Oven Adjustment Effects on a Solder Reflow Profile,” CIRCUITS ASSEMBLY, August 2009.
is semiretired and principal of Fred C Dimock Global Services (fcd-global.com). He has more than 40 years’ experience in high-temperature soldering and sintering, including more than 20 in SMT reflow soldering; fred@fcd-global.com.


Press Releases
- Altus Adds LPKF CuttingMaster 3290 to Depaneling Portfolio
- Kurtz Ersa Partners with E-tronix for Sales in Illinois and Wisconsin
- XLR8 EMS Welcomes Raul Jorge Lopez Jr. as Director of Program Management and Procurement
- Koh Young America Promotes Ramiro Mora to Lead Service and Applications in Mexico and South America