ABCs of PCB Cleanliness Testing


Know the capabilities – and limitations – of diagnostic practices.
What do you get when you mix atmospheric moisture with ionic residue on a PCB? A recipe for disaster!
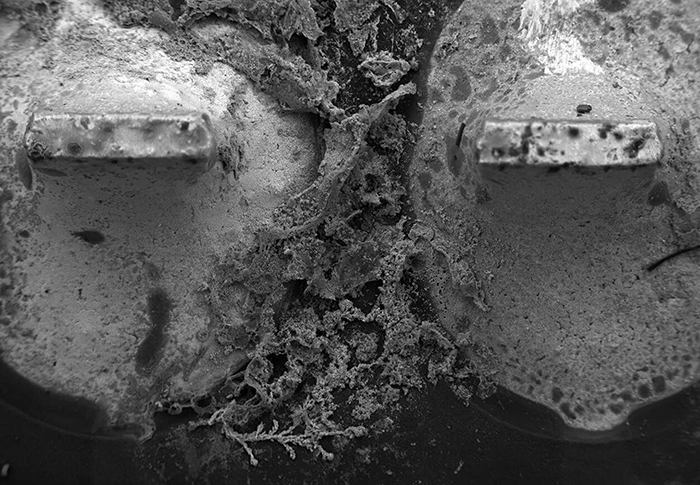
ECM, or electrochemical migration (FIGURE 1), can wreak havoc on a circuit assembly, causing everything from harmless signal glitches to complete failures. Despite the many safeguards in place to avoid it, there are still plenty of opportunities for ionic contaminants to make their way onto a circuit board. If one does, finding and eliminating its source can be a daunting task.

Figure 1. SEM image of dendritic growth shorting conductors. (Image courtesy STI Electronics)
No single analytical method can provide information on what the contaminant is and where it came from. When a failure is sent to a lab for analysis, scientists will likely perform one of two tests to identify its composition based on the nature of the failure and its appearance:
- FT-IR. Fourier transform infrared spectroscopy is often used to analyze the visible residues of stains, unknown materials, or in specific areas, like under low-clearance components. FT-IR uses light absorption spectra to produce a molecular fingerprint for the material in question and compares it to those in a database. By matching the spectral signatures, this method can identify unknown organic substances.
- IC. Ion chromatography is typically used when inorganic or ionic contamination is suspected, such as when a PCB assembly fails a ROSE test (described below) or if leakage current is detected but no residues are visible. IC extracts residues from the assembly and analyzes them to identify and quantify ionic contaminants such as bromides, chlorides or sulfates.
Both analytical methods require sophisticated lab equipment and trained analysts. Once the contaminant(s) are identified, however, their sources must be investigated in order to permanently resolve the issue. Root cause analysis relies heavily on human experience and expertise. Certain organic contaminants are typically associated with particular fluxes, and many ionic contaminants are known to be associated with specific PCB fabrication, component manufacturing or assembly/cleaning processes. Occasionally, if the identified material is not associated with a manufacturing product or process, highly specialized experts and tests are needed to help pinpoint the cause and permanently eliminate the problem.
What’s better than permanently eliminating an ionic contamination problem? Preventing it! Upfront process qualification and monitoring can save time, money and reputations at a fraction of the cost of failure analysis and product replacement.
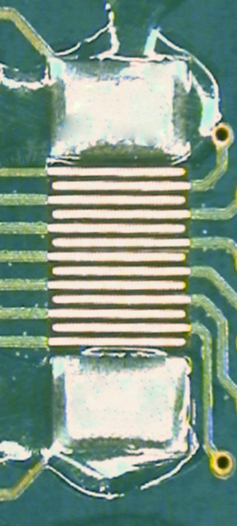
SIR. Surface insulation resistance qualifies a process by testing the electrical conductivity/resistivity of flux residues after cleaning, or after soldering for no-clean processes. Testing is performed in environmental chambers under specific voltage bias, temperature and humidity conditions. An interlaced “comb” test pattern (FIGURE 2) is energized, and electrical resistance is recorded every 20 min. for 7 days. If dendrites grow, they will cross the conductors in the comb pattern, completing a circuit and lowering the resistivity of the affected surface.

Figure 2. SIR comb pattern to test cleanliness under component.
The SIR test qualifies the process under which it was produced. (For more complete information on SIR testing, see http://circuitsassembly.com/ca/2013-articles/22684-sir-testing.html.) Changing fluxes, soldering processes, cleaning chemistries or wash parameters may change SIR performance and necessitate requalification. Regular, periodic SIR testing can ensure consistency and keep process drift in check. Many commercial laboratories offer SIR testing according to IPC or custom specs, and as with any critical validation test, SIR is best performed by an independent third party. While the popularity of SIR testing is increasing, some assemblers still rely on the lesser robust methods of ROSE testing or visual inspection.
ROSE. Resistivity of solvent extract is a well-established and extremely popular production floor staple. This test, commonly referred to by the machine’s trade name, such as Omegameter, Ionograph, Zero Ion or Contaminometer, extracts surface residues with an isopropyl alcohol (IPA) and deionized water mixture and analyzes the total ionic content, reporting the average for the entire PCB. Unfortunately, this test method cannot discern if the ionic material was concentrated under a connector or low standoff component, nor can it discern if all the residues were extracted, as many modern fluxes are not fully soluble in IPA or water.
ROSE is a simple and easy process control tool, but it is not a great indicator of localized cleanliness problems or flux-IPA incompatibilities. Repeated good ROSE readings can’t necessarily guarantee there is no residual contamination in tight spots or that all the flux residues were extracted and analyzed, but a bad ROSE reading clearly indicates something is wrong with the process and is a red flag for intervention. ROSE also has a role in troubleshooting. Bare boards are a common source of ionic contamination, so this is often the first test run because it can quickly verify or eliminate incoming PCBs as the root cause of the problem.
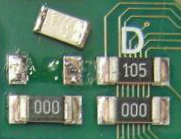
Visual inspection. Visual inspection is a common detection method, used both in labs and on production lines. It doesn’t have an abbreviation or acronym, just a long history. Analytical labs will visually inspect and document residues with optical, digital or even scanning electron microscopes in their determination of test methods. On production lines, inspectors will use ring lights or microscopes to look for visible residues around fine pitch or low standoff components. If residues are observed after cleaning, they should definitely be checked out, most likely with FT-IR. A word of caution on visual inspection: many ionic residues are not visible. Just because the dangerous residues can’t be seen does not mean they aren’t there, silently waiting to create a catastrophic failure down the road. Visual inspection is a key element of detection and problem solving, but solely relying on it to monitor production is a very risky practice (FIGURE 3).

Figure 3. The dangers of visual inspection. No flux residue is visible around the components, but part removal reveals flux contamination underneath the packages, bridging the conductors.
Ionic contamination can be the root cause of many assembly failures. It may manifest itself in the form of current leakage, corrosion, opens or shorts, causing PCBs to fail either catastrophically or, much to the dismay of the troubleshooters, intermittently. Many field failures due to ionic contamination can be prevented by understanding design implications and implementing robust processes with accurate controls, but others are completely unavoidable. Even with the most stringent protections in place, contamination can happen. Soils can sneak in on PCBs, components or handling equipment; soldering or cleaning processes can subtly drift out of control, and the human element is ever present in production operations. Understanding diagnostic practices in the lab and process monitoring methods on the line is essential to investigating – and ultimately preventing – contamination-related failures.
is North American manager, electronics. , is chief technology officer at Kyzen (kyzen.com); debbie_carboni@kyzen.com.
Press Releases
- Smartsol and Koh Young Technology Announce Strategic Partnership for the Mexican Market
- RBB Systems Boosts Manufacturing Capabilities with Equipment Upgrades for 2026
- 11th Class of Engineering Interns Begins Forging Success at Hyrel
- Rocka Solutions Announces 2026 Rockin’ Roundtable: An Interactive Discussion on What Really Drives SMT Printing Performance


