2005 Articles
Reducing BGA Defects with AXI Inspection
This study established the ideal sensitivity setting for catching BGA voids.
Inspection of BGAs and detection and measurement of BGA voids has become critical as use of BGAs on assemblies has increased. How large can a BGA void be and still be considered acceptable? First, we must ensure that we have an accurate method to measure BGA voids. Second, we must ensure that the criteria we use in setting BGA void rejection is in agreement with IPC standards or customer specifications.
The objective of our work was to:
- Assess the current setting for the Agilent AXI 5DX BGA2 void algorithm in detecting voids.1
- Compare and correlate the voiding measurement data between AXI laminography and transmission x-ray systems.
- Discuss how AXI technology can be used for process improvement in reducing BGA defects.
Detection of BGA voids with the AXI system and the accuracy of the measurement made is a function of one of the machine’s void algorithm thresholds called the sensitivity setting. This threshold sets the level of gray-scale at which pixels are to be considered part of a void. The larger the setting is, the larger the number of pixels that are considered to be part of a void. The AXI measurement of BGA void size and percentage is dependent on the AXI algorithm’s sensitivity setting number. We studied this measurement data (BGA voiding diameter and area percentage) with the SPC tool MINITAB for analysis of variance (ANOVA). The ANOVA showed the mean of the standard deviation (StDev) for a selected BGA void diameter to be 0.6345±0.3418 mils, 0.6273±0.5435 mils and 1.1155±0.5766 mils with sensitivity settings 0.25, 0.35 and 0.45, respectively. The ANOVA showed the mean of the StDev of the BGA void percentage to be 2.200±0.953%, 2.834±1.602% and 5.115±2.546% with sensitivity settings of 0.25, 0.35 and 0.45, respectively. Based on the data it appears that an algorithm sensitivity setting of 0.25 is good starting number for BGA voiding. The transmission x-ray measurement data was used for comparison.
The AXI test reports attribute data, but the system can provide variable data as well. With variable measurement data from this automatic test method, AXI is a good SMT process improvement tool, as well as a tool for process defect detection.2-3 The variable data can help us effectively control SMT processes. We will also discuss how to reduce BGA defects using AXI measurement data to search optimized profiles. Decreases in BGA defects can lead to manufacturing cost savings. As a result of our use of this AXI defect detection data, we were able to significantly reduce the occurrence of BGA defects, which resulted in a cost savings of over $40,000 in a period of four months.
Key words: BGA, Voiding, Algorithm, sensitivity setting, Laminography and transmission.
Introduction
More and more BGAs are being used on PCB assemblies. With AXI, we are able to automatically test BGAs and detect defect characteristics of their solder joints, such as shorts, opens, excess, insufficient solder, misalignment and voiding. It is common to see BGAs with some degree of process voiding. Void measurements can be taken which capture both the void diameter and void area percentage. IPC-A-610C and IPC7095A specify BGA void acceptance levels for different manufacturing classes. The questions are: How do we get these measurements of void diameter and area percentage? and What is the accuracy of the measurements that we get from the AXI 2-D x-ray systems? The variable measurement data depend on the machine type, working conditions, the camera’s frame grabber setting, the algorithm threshold settings and many additional variables and parameters including the number of board layers and the BGA package type. The operator’s technical level is an obvious variable if using manual test mode. In this article, we focus on the measurement of voids associated with plastic BGA balls and the accuracy of the measurements as a function of the sensitivity setting of the AXI BGA void algorithm. We present more than 10,000 measurements taken automatically of a BGA package from AXI. The analysis of these data using the SPC tool MINITAB is also presented. The results show that we have identified a good setting for the sensitivity threshold of the void algorithm. We determined the sensitivity setting which works best in the detection and rejection of solder joints which do not meet our acceptance criteria while at the same time allows us to maintain a reasonable false call rate.
There are many transmission 2-D x-ray systems for PCB testing. All 2-D x-ray measurement data shown in this paper are from the 2-D x-ray system except the last column data from Table 3. This 2-D x-ray system is able to measure voiding with a programmed application, and it is similar to AXI performance. The advantage of the 2-D x-ray system is that it can achieve resolution down to 950 nm. It is also able to tilt the image intensifier to inspect BGAs with high magnification, and identify void’s location with manual mode. The disadvantage is its test cycle time and the fact that it is operator-dependent if test board is in manual mode.4 The BGA void measurement results in diameter and percentage from two 2-D x-ray machines are also presented for comparison.
In manufacturing, “prevention is better than detection,”5 but it can only occur with accurate and timely data feedback within the manufacturing process. We can use AXI to identify BGA solder joint defects per variable measurement data, and to assist in making timely decisions for necessary changes to processes or materials that are largely responsible for these voids. We can use the AXI system not only as a test tool but also as a useful process improvement tool.
Traditionally x-ray has been used to inspect BGA assembly for defects such as shorts, misalignment, missing balls and voiding. Measurement accuracy is based on the x-ray equipment’s capabilities and operator experience. AXI laminography is able to automatically separate solder joints into individual layers. The resulting detailed slice images are easily analyzed online using gray-scale level (256 gray level) processing. With the frame grabber, the x-ray image is captured. It is then transferred into the 5DX memory, where the image is analyzed automatically by test algorithm software modules of the Image Analysis Software (IAS). 6 The analysis provides test results and real-time process control feedback data.
Table 1 lists the BGA void accept/reject criteria for different classifications from IPC-7095A.7 For Class 2, the process control criteria are 20% of area, and 45% of diameter for the voids within the ball after assembly reflow. For example, for a BGA ball size of 0.024", rework should be performed if the voiding diameter is larger than 0.0108". To meet the requirement of BGA voids detection with a reasonable false call rate there are several criteria. First, we must ensure that we set the correct camera frame grabber number, giving us images with good contrast between ball and background, which help in preventing escapes of void diameters of 0.0108" or greater. It is also necessary to have images with good contrast for our repair operators to visually confirm defect calls at the repair station.
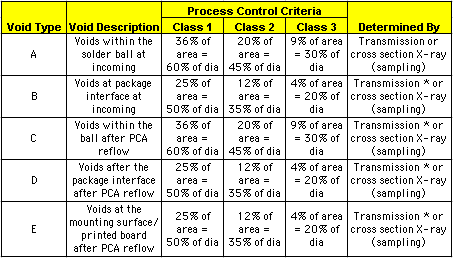 |
| TABLE 1: Accept/Reject criteria for BGA void size limitations. |
Figures 1 and 2 show the images of a void at pin number 9 with the following algorithm settings using the Agilent AXI software v. 7.3: a) sensitivity of 0.25, b) MIN_VOID_DIA of 0.009", c) PERCENT_VOID of 20% and d) a camera frame grabber setting of 3 as shown in Figure 1, and frame grabber setting of 5 as shown in Figure 2. This plastic BGA has 289 pins with pitch size of 0.040" on a 28-layer PCB.8 The images show that the BGA void measurement reading has increased with the increased camera frame grabber setting. From our experience, there is about 0.001" difference in the measurement for the setting camera frame grabber difference of 2. Figure 3 is the image for the same BGA with a setting of camera frame grabber setting of 5 by using new version of AXI 5DX software v. 8.1. Figures 2 and 3 show images with good contrast between BGA ball and background. Our study shows that using software v. 8.1 and a frame grabber setting of 5 is most discriminative in detecting voids.
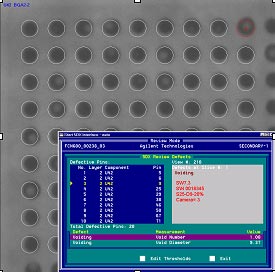 |
| FIGURE 1: Image of BGA voiding with camera frame grabber setting of 3 (AXI software v. 7.3). |
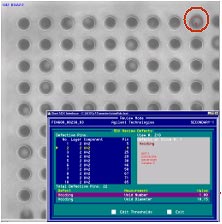 |
| FIGURE 2: Image of BGA voiding with camera frame grabber setting of 5 (AXI v. 7.3). |
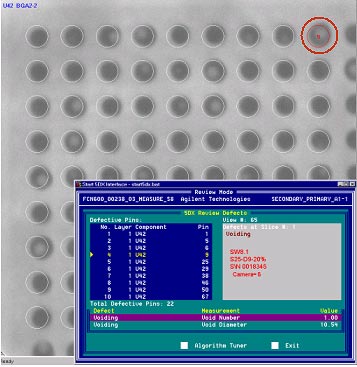 |
| FIGURE 3: Image of BGA voiding with camera frame grabber setting of 5 (AXI v. 8.1). |
BGA voiding measurement data strongly depend on the algorithm sensitivity setting. One of the limitations of the AXI system is that the voiding diameter and area percentage readings are repeatable. So, what is the exact diameter of a void for a given void within a BGA? What is the mean and standard deviation of the BGA’s voiding measurement? To have better settings for catching BGA voiding with current variable data accuracy levels, we tested a BGA nine times for each of the different sensitivity settings with Agilent v. 8.1. The voiding thresholds MIN_VOID_DIA and PERCENT_VOID were set to 3 and 5%, respectively. We tested all 289 pins of the BGA. By eliminating readings of “0,” the total number of pins of void diameter is 175, and the total number of pins of void percentage is 164. Table 2 lists some measurement data for voiding diameters, where D25, D35 and D45 column represent the diameter size with a sensitivity setting of 0.25, 0.35 and 0.45, respectively. We used the SPC tool MINITAB to analyze the data for ANOVA, and the results with sensitivity settings of 0.25 and 0.45 are shown in Figures 4 and 5. (All data shown in this paper are calculated with 95% confident interval.) In Figure 4, there is no difference (P=0.991) between nine measurements with sensitivity of 0.25, where P value is probability of the mean that are equal. However ANOVA shows there is a difference (P£0.05) between the nine measurements with sensitivity of 0.45 (Figure 5). There is about 0.0016" difference for the diameter mean between these nine measurements with sensitivity setting 0.45. The average number of false calls will increase to about 100 calls with a 0.45 sensitivity setting.9 Figure 6 lists the grand average void diameter for 1575 readings of the BGA voids with sensitivity setting of 0.25, 0.35 and 0.45. The average of diameter reading with a sensitivity setting of 0.45 is more than 0.002" bigger than the average diameter calculated with a setting of 0.25. The data also showed that standard deviation numbers were increased when sensitivity setting numbers were increased.
TABLE 2: Some BGA voiding diameter data of 175 pins with sensitivity settings of 0.25, 0.35 and 0.45. (Click here to see PDF file.)
FIGURES 4-14: Click here to see PDF file.
Table 2 also lists partial data of mean and StDev data from nine readings for the 175 total pins with a sensitivity setting of 0.25, 0.35 and 0.45, respectively. We analyzed these mean and StDev data for ANOVA by using the MINITAB. Figures 7 to 10 are the results of ANOVA. These results were obtained from 4725 readings of void diameters and 4428 readings of area percentage with 95% confidence. Figure 7 is void diameter mean versus sensitivity settings of 0.25, 0.35 and 0.45. The ANOVA shows that the mean of the BGA void diameter is 8.339±0.1378 mils, 10.093±1.269mils and 10.725±1.015 mils with the sensitivity settings of 0.25, 0.35 and 0.45, respectively. In Figure 8, the ANOVA shows that the mean of the StDev for the BGA void diameter is 0.6345±0.3418 mils, 0.6273±0.5435mils and 1.1155±0.5766 mils with the sensitivity settings of 0.25, 0.35 and 0.45, respectively. The ANOVA shows that the mean of BGA void percentage is 16.543±2.888%, 23.706±3.038% and 26.763±2.944% with the sensitivity settings of 0.25, 0.35 and 0.45, respectively (Figure 9). The ANOVA shows the mean of StDev of the BGA void percentage is 2.200±0.953%, 2.834±1.602% and 5.115±2.546% with the sensitivity settings of 0.25, 0.35 and 0.45, respectively (Figure 10). All four figures indicat that the measurement results are different with sensitivity settings of 0.25, 0.35 and 0.45. Obviously more deviation exists for the readings with a sensitivity setting of 0.45. Between algorithm sensitivity settings of 0.25 and 0.45, the difference of mean of voiding diameter is about 0.002", and difference of mean of voiding area percentage is above 10%. It is easy to understand why there is higher rate of false calls with a sensitivity setting of 0.45.
We also manually measured voiding for several of the pins using the AXI system in its 2-D mode and used these measurements for comparison with the measurements taken in its automatic mode. Most of the manual measurement data collected was closest to the automatic readings taken while testing with software v. 8.1 and a sensitivity setting of 0.25. Therefore we believe that the algorithm void sensitivity setting of 0.25 is a good starting point in detecting true BGA void defects while maintaining a reasonable number of false calls. The false call rate is less than one with sensitivity of 0.25, and is about four with sensitivity of 0.45. The definition of false call rate is ratio of false calls over real calls.
SMT Detection Methods
All components and boards for one customer’s assemblies are tested on AXI 5DX systems. BGA solder voids were detected by 5DX on a plastic BGA on network boards. Some voiding defects mistakenly escaped from the repair station at the beginning. Per our data study, we must educate operators to understand that there is about 0.001" deviation for the 5DX measurements with sensitivity setting of 0.25, and also about 0.001" difference for the 5DX measurements with auto and manual mode at AXI. Therefore, we need to perform rework when the AXI rejects BGA pins as a voiding defect for the most time. It is common to find voids over the entire BGA device if the SMT process is out of control. Ensuring the PLR operators are doing rework for real BGA voids are critical. We also request our 5DX operators to notify the process engineer and technician about a potential process issue when they see any consecutive or repetitive defects including small size BGA voiding.
We use 5DX variable data to help identify the optimized top and bottom reflow profile. The solder voiding defect has been known to be a problem when using water-soluble paste (Sn37Pb63). The balls of this BGA are composed of Sn37Pb63. Note that the alloy of the BGA component ball affects reflow profile. With variable data of AXI, it is easy to optimize the reflow profiles through design of experiment (DoE). After having experimented with more than 10 different oven profiles, we were able to identify a profile that minimizes the presence of BGA voids (Figure 11). As can be seen in Figure 11, there is no significant voiding in the BGA. Figure 12 shows a non-optimized bottom reflow file, and Figure 13 the optimized bottom reflow profile. Based on the result of our experiment, using Alpha Metals WS609 solder paste on a HASL (hot air solder leveling) finish board, we concluded that the profile with 110 to 120 sec. longer soak time from 130 to 160°C, 200~205°C low peak temperature, and 75~85 sec. TAL (time above liquidus) produced the fewest solder voids.
According to the acceptance criteria of Class II, we set MIN_VOID_DIA = 0.009", PERCENT_VOID = 20% and sensitivity = 0.25 for this BGA with ball diameter of 0.024". The reason we set the void diameter = 0.009" for the ball diameter of 0.024" was due to the measurement deviation. The repeatability of BGA voiding measurement of AXI is not as good as the repeatability of BGA slices diameter. Therefore, we tightened the criteria of void diameter. Table 3 lists the voiding diameter of 13 pins that were taken first using Agilent 5DX software v. 7.3, then again with v. 8.1, and finally using two 2-D x-ray machines. The data in the first five columns are the average of nine readings. The diameter increases as the sensitivity number increases. The data in the last two columns are the measurement readings from two different 2-D x-ray machines with manual mode. The 2DX machines do not have the capability to capture void diameter measurement data automatically. The 2-D x-ray data are larger than the reading with sensitivity of 0.25 on the AXI machine for this BGA. The manual measurement is highly operator-dependent. However, we can use 2DX to identify the AXI algorithm settings because of their high magnification. Figure 14 is our experiment’s data from AXI 5DX and Dage 2DX systems. The void percentage measurement data of transmission x-ray are greater than the readings from AXI. AXI data indicated the void diameter of middle of ball, and 2DX data showed the largest void diameter. However, both the 5DX and Dage machines catch all real void defects with low false call rate of less than one per our studies. It should be safe to assume that the AXI catches BGA voiding to meet IPC-7095A Class II criteria with the algorithm: MIN_VOID_DIA of 0.009", PERCENT_VOID of 20% and sensitivity of 0.25 for the BGA with ball diameter of 0.024".
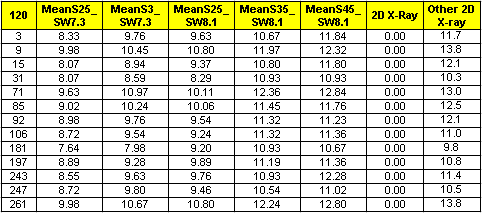 |
| TABLE 3: Diameter (mils) measurements from AXI and 2-D x-ray machines. |
With the 5DX variable measurement data for BGA void, we are able to optimize SMT reflow profiles in a timely manner. With improvements made, we did not see voiding to the extent as before. If voiding is present, we are confident that the newly optimized setting will detect it using 5DX. We reduced BGA defects by 0.5% by analyzing 5DX measurement data and oven profiles on one customer’s assemblies. The BGA numbers in Table 4 correspond to BGA defect reduction from historical data for each assembly of the customer. Table 4 shows one customer’s realized savings after reduced BGA voiding last year.
 |
| TABLE 4: One customer’s realized savings in 2004. |
Conclusions
Many algorithm settings on AXI 5DX affect the detection of solder defects. The algorithm void settings depend on the characteristics of the PCB and components. Therefore, they must be adjusted accordingly. Based on our data it appears that an algorithm sensitivity setting of 0.25 is good starting number for BGA voiding for most BGA packages. However, there is no universal number for catching all voids under various conditions.
Even though the AXI test reports only provide attribute data, we are able to retrieve variable data (actual measurements) from the system as well. With variable measurement data from this automatic test method, the AXI 5DX is a good SMT process improvement tool, and is useful for process defect detection. The variable data can help us to control SMT process effectively. Once the oven profile was optimized, BGA defects were reduced significantly.
Transmission 2-D x-ray can tilt the image intensifier to inspect BGAs with high magnification, and it can help verify 5DX algorithm settings or identify BGA void defect locations (at the package interface, ball or PCB).
References
- Agilent x-ray laminography inspection systems (5DX Series II, 2L and Series 3).
- Zhen (Jane) Feng, Jacob Djaja and Ronald Rocha, “Automated X-Ray Inspection: SMT Process Improvement Tool,” SMTA International Proceedings, September 2002.
- Glen Leinbach, “Using Production Defect Data to Improve an SMT Assembly Process,” SMTA International Proceedings, September 2000.
- Steve Harris, Harjinder Ladhar and Sundar Sethuraman, “Capabilities of Tools Used to Measure Voids to Industry Standards,” IPC Apex Proceedings, March 2003.
- Rob Rowland, “What is Quality?” SMT, December 2001.
- Agilent 5DX Manuals, N7200-19501, rev. F, software release 8.1, 2003.
- IPC-7095A, Design and Assembly Process Implementation for BGA, October 2004.
- Texas Instruments plastic BGA 289 pins; package size 19.2 x 19.2 mm; ball size 0.60 mm; pitch size 1.0 mm.
- Experiment results from Flextronics San Jose operations 5DX team, July-August 2004.
Acknowledgments
Flextronics engineering and production teams, San Jose buildings 3 and 7, and the Agilent hardware and software support teams. Special thanks to Mark Jones, David Pham, C.C. Ho, Duston Yau, Mark Evans, Tim Vo, Dason Cheung, Jane Phan, Thong Le, Lien Au, Ming Zhong Tang, Barbara Koczera, Heidi Hanson and Joe Reisinger.
Zhen (Jane) Feng is senior staff engineer-Americas; Eduardo Toledo is project manager, San Jose operation; Jonathan Jian is process engineer, San Jose operation; and Murad Kurwa is vice president engineering-Americas, Flextronics International (flextronics.com); jane.feng@flextronics.com.
Press Releases
- Benchmark Appoints Josh Hollin as Senior Vice President and Chief Technology Officer
- 2026 IEEE Electronic Components and Technology Conference Student Innovation Challenge Pre-registration Deadline Extended to January 11, 2026
- PCBsync PCB Assembly Introduces Full-Scale Electronic Manufacturing Service
- Magic Leap Partners with Pegatron for AR Glasses Components Production


