

Advances in Concentration Monitoring and Closed-Loop Control
Contaminated bath water skews refractive index results. New technology can accurately measure aqueous cleaning agent concentration.
Numerous critical process parameters must be monitored and controlled to efficiently and effectively yield the expected cleaning results for a qualified cleaning process. For batch or inline spray-in-air cleaners, these include items such as wash temperature, spray bar configuration, nozzle selection, spray pressure, exposure time and cleaning agent concentration. The latter is the most difficult to monitor and subsequently control for as it is progressively compromised, as it becomes loaded with contaminants and in particular, flux residue. For many years, the standard method for assessing wash bath concentration has been refractive index. Its primary instrument, the refractometer, is inexpensive and easy to use, and the process is fast. This is certainly an effective method for measuring a fresh bath, and when combined with pH measurement, an operator can assess the organic and alkaline levels of ingredients in the wash solution. One must note that the refractive index of a medium is a measure of the speed and direction of light passing through the medium, and this is ideal for a pure solution (Figure 1). For a fresh cleaning agent, there is a linear relationship between the refractive index value and cleaning agent concentration.
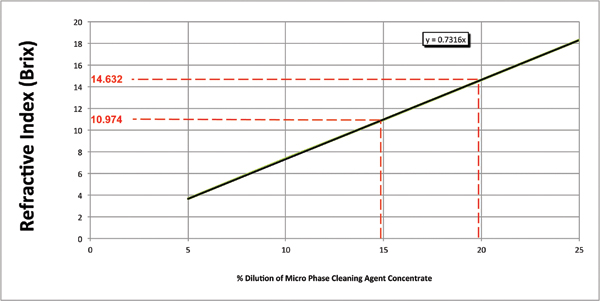
Figure 1. Concentration by refractive index.
In the world of aqueous cleaning, wash baths become contaminated with flux residues over time. Flux residues affect the speed and direction of light as it passes through the sample medium, thereby introducing unpredictable measurement errors.1 This means the measured concentration of the cleaning agent may be significantly over- or understated. For example, the targeted concentration may be 10%. The operator checks the wash bath concentration and discerns through refractive index a concentration of 20%. Thus, DI-water is added to reduce the concentration to the specified level. The actual wash bath concentration may well have been at 10%, and since an erroneous reading was obtained, and the wash bath was diluted, the actual concentration is significantly lower than the desired amount. The result: an out-of-spec process to worsen and therefore unknowingly yield assemblies outside the quality specification. Thus, identifying an improved test method to easily and accurately determine wash bath concentration is critical to an efficient and effectively managed aqueous cleaning process.
How does one accurately determine the concentration of chemistry, or an aqueous-based cleaning solution that comprises flux residues, as well as a wide variety of SMT-related residues that are entrained in a cleaning system wash bath?
For cleaning agent manufacturers that develop and blend their solutions, gas chromatography (GC) is an ideal test method for fresh or uncontaminated product. In this case, all constituents are known to the manufacturer and can be easily identified. When trying to examine contaminated samples with unknown constituents, having to select appropriate columns ahead of the analysis is difficult at best. Complications arising from the presence of unknown components are common to virtually all chemical analysis techniques, including chromatography. Thus, it is necessary to rely on experienced analysts making sensible accommodations for the presence of unknown species based on the fact that major contaminants can be reasonably guessed using flux formulations. It is also necessary to refrain from expecting the same quantitative accuracy, as in uncontaminated samples. With such caveats, GC remains a useful, yet non-practical technique for analyzing contaminated samples.
The chemical situation is further complicated in a mathematical sense by the fact that the total number and type of species within a contaminated wash bath is unknown. If it were somehow known that N different species were present in a sample, selecting a battery of analysis techniques that can give N different analysis values would provide a deterministic signature for the chemical profile. Thus, in such a multi-species environment, the practical approach to characterization is to choose sensing techniques based on their selectivity; that is, one chooses a sensing technique that returns a large signal for the species of interest, and a small or no signal for other species.
Trying to bridge the gap between the inaccuracy of refractive index measurements, when used for contaminated wash baths and the inherent difficulty of analyzing unknown and non-volatile species through the use of GC, has fueled the drive to develop alternate technologies. One approach to maximizing selectivity is to target the chemical behavior of the known components of the cleaning agent. This approach enables the chemists who develop the cleaning agents to choose from a very large universe of possible chemical behaviors and reactions to precisely target the desired species. Therefore, the next step in the evolution of concentration measurement tools was the development of the chemically targeted phase separation analysis technique.
One such commercially available technique is the Zestron Bath Analyzer. This was designed as a targeted physical reaction for the selected cleaning agents. During its development and beta testing, the results obtained using this technique were compared directly against those obtained through GC analysis for both a fresh cleaning agent (Figure 2), as well as a flux contaminated bath at a customer location (Figure 3). In each case, a micro phase cleaning agent was analyzed.
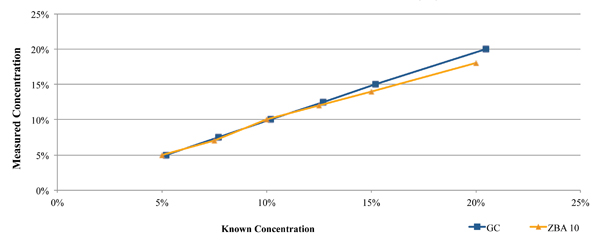
Figure 2. Results of bath analysis compared to fresh micro phase cleaning agent using known concentration.
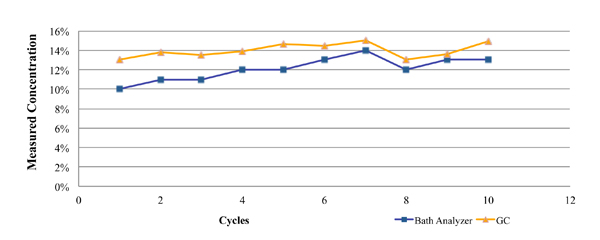
Figure 3. Results of bath analysis compared to fresh micro phase cleaning agent using known concentration.
As seen in Figure 2, the concentration measurement results using the GC and novel techniques accurately indicate concentration when compared directly against the known concentration of fresh aqueous engineered cleaning agent.
Figure 3 represents GC and novel technique data from a customer location. These data were developed through the analysis of partially loaded bath samples collected from a batch cleaning application over a four-week period. As noted in the graph, the concentration as measured by the novel technique closely mirrored that of the GC analysis, with a maximum difference of 3%.
With the novel technique, a wash bath sample may be analyzed in real time. On the basis of this analysis, concentrate or DI-water could be added as required to maintain the desired wash bath concentration. Additionally, when analyzing alkaline products, a color reaction indicates if the alkalinity of the wash solution is satisfactory, which is an indication of wash bath life. The novel technique is a manual process whereby the operator must extract a well-mixed wash sample, typically from the spray bar, monitor the process daily and add concentrate and/or DI-water as required.
Figure 4 represents data from a company that was using an inline aqueous cleaner and micro phase cleaning agent. In this case, there was a wide concentration process window ranging from 12.5% to 20%, with an average of 16.25%. The process was monitored over the course of several weeks by both refractive index and the novel technique, and the concentration manually corrected as required. As can be seen in the graph, it is clearly evident when the concentration drifted and when corrective action was taken – that is, concentrate added to bring the wash solution back into the targeted concentration range. Throughout the testing period, the concentration determined by refractive index continued to be overstated, reaching a maximum reading of nearly 38%. Had the operator reacted to this erroneous reading by adding DI-water, the wash bath concentration would have been significantly diluted, inhibiting cleaning effectiveness and potentially impacting the reliability of the electronic assemblies.
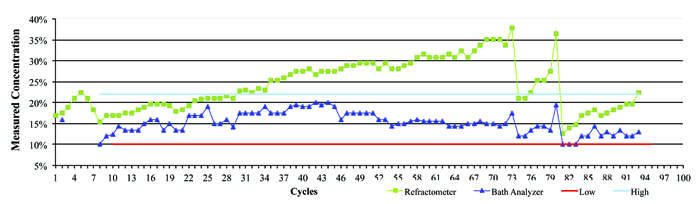
Figure 4. Field data showing refractive index vs. bath analysis.
Since 2009, the novel technique has been recommended as an alternative to refractometry for fast, accurate wash bath concentration measurement. However, the desire remained to develop a method that could indicate accurate wash bath concentration automatically, consistently and in real time.
The authors determined that the solution for assessing wash bath concentration resided in measuring liquid flow concentration “in line” as the wash solution is pumped to the spray bars, for this is the liquid that is in direct contact with the assembly surface during the cleaning process. Careful consideration was given to numerous available sensor options, including capacitance, acoustic and optical. However, identifying a technology and adapting it such that its output can be calibrated for an aqueous-based cleaning agent in the presence of flux residues, as well as other process contaminants, posed a significant challenge.
As noted, fresh wash bath concentration is an engineered aqueous-based cleaning agent, and thus all constituents and their relative proportions are known to the manufacturer. Given this fact, numerous concentration measurement technologies were considered by the authors and ultimately an acoustic method chosen as most appropriate for this application. This decision was made primarily due to its selectivity toward the desired cleaning agents under consideration. However, the authors understood that additional characteristic data of the flowstream were required to account for entrained contaminants. Here, we address the technological advancements made in adapting liquid flow sensor technology in order to develop a concentration monitoring process capable of accurately measuring wash bath concentration in the presence of flux loading.
Methodology
Numerous flux types and engineered cleaning agents are used in electronics manufacturing. To focus this study, the authors decided to conduct all tests using one of the modern cleaning agent types – that is, micro phase technology, herein referred to as the cleaning agent, as well as one flux type. The selected flux type was mildly activated rosin flux (RMA). Given this flux scenario, rosin would be a significant contamination contributor within the wash bath. Thus, for all flow sensing technologies evaluated, a key requirement was minimal selectivity toward rosin.
As discussed, there are numerous methods to determine wash bath concentration. For fresh as well as flux-loaded wash baths, the authors had significant data from in-house tests and customer sites using GC and the novel techniques. Thus, it was decided that the flow sensor concentration data would be compared against GC and the novel technique as a point of reference for concentration accuracy throughout this study. All GC measurements were performed at a Zestron Technical Center.
An acoustic measurement technology was chosen as the most appropriate automated concentration monitoring technique for the aqueous-based cleaning agents. The selected device, called Flowsensor, included an inline flow sensor and digital controller for concentration and temperature display. Ultimately, two types of these novel sensors were evaluated: a handheld benchtop device for single point measurement and an inline device for continuous measurements. Both capture not only acoustic wave data, but also the signal amplitude and signal dampening effect over time. The results of each were found nearly identical.
Utilizing the novel sensors, data from various benchtop experiments as well as spray-in-air cleaner installations were collected. All initial testing was conducted with fresh cleaning agent mixed to known concentrations. Using an algorithmic calculation, the sensor data stream was characterized such that the raw novel sensor data could be converted to a concentration percentage. These data were compared against both GC and the novel technique concentration measurements to evaluate and confirm sensor accuracy.
Figure 5 represents the GC, novel technique and novel sensor data as compared to the known cleaning agent concentration. For the novel sensor measurements, the cleaning agent temperature was 60°C, whereas for refractometry and Bath Analyzer, measurements were taken at room temperature. For GC analysis, the standard temperature protocol was followed.
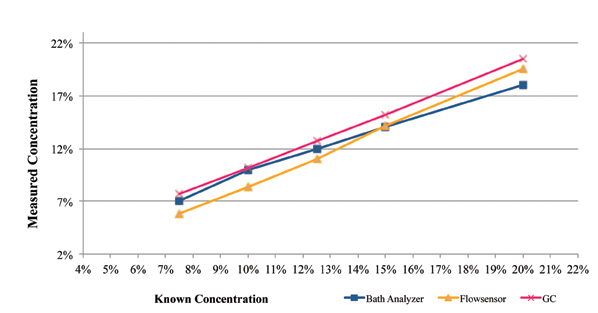
Figure 5. Cleaning agent concentration analysis.
As indicated by this data set, the GC and the novel measurement techniques accurately measured the concentration. The novel sensor measurement was within 1.6% of the known concentration at 10% percent concentration and above.
At this stage of product development, the novel sensor concentration variance was deemed acceptable. The next step was to consider the impact of flux residues on the novel sensor concentration measurements.
The process of analyzing the impact of flux residues was conducted in three stages. Since rosin is a significant component of RMA flux, the authors first examined its
impact on the novel sensor measurements. Following this assessment, the impact of flux residue was examined through controlled tests and, finally, wash bath analysis from beta site testing at a customer location.
A design of experiment was developed and executed in three phases:
Phase 1: Rosin load analysis, to evaluate the impact of rosin on concentration monitoring techniques, including the novel sensor and refractive index.
Phase 2: RMA flux load analysis, to evaluate the impact of various amounts of flux residue on various concentration monitoring techniques, including the novel sensor, bath analysis and refractive index. This test is to be conducted in the absence of any other SMT assembly contaminants.
Phase 3: Beta site test data. Employing the novel sensor, wash bath concentration field data were assessed by direct comparison to the bath analysis, refractive index and GC techniques.
Regarding cleaning agent temperature measurements, all novel sensor measurements were taken at 60°C; refractometry and bath analysis measurements were taken at room temperature, and the standard temperature protocol was followed for all GC analyses.
Main Research
Phase 1: Rosin load analysis. This analysis was conducted in a controlled environment whereby the volume of rosin and known concentration of the micro phase cleaning agent could be precisely measured, mixed and analyzed at a constant temperature.
To facilitate this evaluation, a custom engineered Automated Laboratory System (ALS) complete with the novel sensor (inline) was developed and employed. Initially, a 15% volumetric mixture of cleaning agent in DI-water was prepared. The liquid solution was dosed into the ALS with precise experimental accuracy. Then, measured quantities of rosin were added into this mixture to a maximum of 1.8%. In a typical inline cleaner with an 80-gal. wash tank, 1.8% rosin equates to 6 kg, a significant contamination load.
The rosin content was measured using refractive index and the novel sensor, with the measurement concentration values plotted in Figures 6 and 7, respectively. As indicated in Figure 6, the refractive index concentration measurements of the 15% prepared solution of the cleaning agent ranges from 14% to 28% at 1.8% rosin load. Thus, the refractive index measurement technique is extremely sensitive to rosin content. As indicated in Figure 7, the novel sensor concentration measurements of the 15% prepared solution of the cleaning agent ranges from 14.75% to 14.9%.
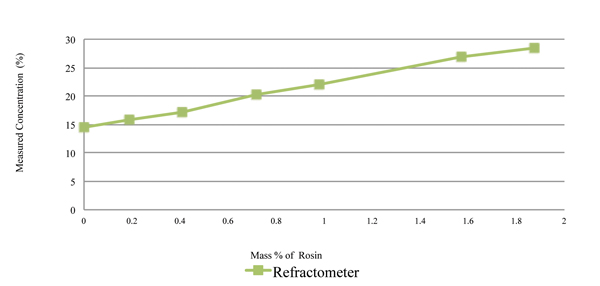
Figure 6. Rosin content measured using refractive index, with 15% cleaning agent and rosin.
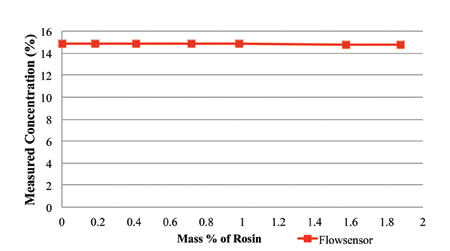
Figure 7. Rosin content measured using the novel sensor, with 15% cleaning agent and rosin.
Figure 8 is a combined graph detailing the impact of rosin on the cleaning agent concentration reading by refractometer and the novel sensor. Thus, acoustic measurement nearly ignores the rosin. It was concluded that rosin greatly impacts the accuracy of refractive index readings, yet has minimal impact on an acoustic measurement technique.
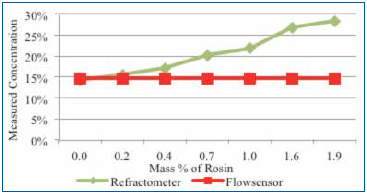
Figure 8. Novel sensor and refractometer results using 15% cleaning agent and rosin.
Phase 2: RMA flux load analysis. To evaluate the impact of flux load on the measurement methodologies, including the bath analysis, refractive index and the novel sensor, the evaluation was executed in two stages:
- Stage 1: Benchtop testing utilizing a 1000 mL beaker and a novel sensor (handheld).
- Stage 2: Installed novel sensor (inline) in the liquid flow line of a spray-in-air batch cleaner and conducted various wash cycles at different concentration levels.
For this test, high solid content RMA liquid flux was sourced. Since these tests were conducted using 1000 mL beakers as well as batch cleaners, concentrated liquid flux was used to minimize the overall flux volume required. To create the concentrated flux, liquid flux was evaporated such that the volume was reduced until it reached the known solid content.
For stage 1, two tests were conducted, Test A and Test B, each one using one liter fresh wash solution samples prepared to known concentrations. For each test, liquid flux with a solid content of 50% was concentrated through evaporation. It should be noted that in the authors’ experience, 3% flux load represents a worst case scenario. Other studies have found the same.2
Typically, one would expect a flux load average of 1.5%, particularly for an inline cleaning system. Generally, flux loading reaches an equilibrium point. As the wash solution is lost due to evaporation and drag out, the concentrated cleaning agent and/or DI-water is added, thereby minimizing the upper limit of flux accumulation.
Test A (benchtop tests): Concentrated flux was added to a 12% concentrate cleaning agent solution in 0.5% increments to a maximum of 3%. Following each flux addition, the concentration was measured by the novel sensor and bath analysis (Figure 9).
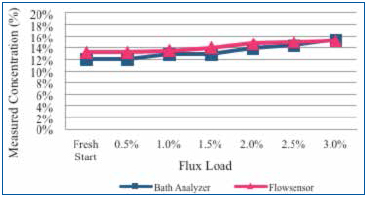
Figure 9. Measure of concentration using novel sensor and bath analysis method as flux influence increases from 0.5% to 3%.
Test B (batch cleaner tests): Concentrated cleaning agent at 7.5%, 10%, 12.5%, 15%, and 20% was prepared. In this case, each concentrated sample was loaded with flux to 3% by volume. The concentration of each flux loaded solution was measured using refractive index, GC and the novel sensor (Figure 10).
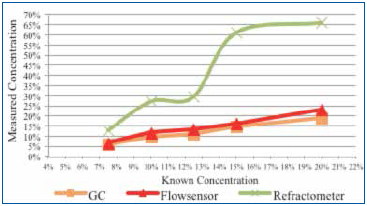
Figure 10. Concentration of each flux loaded solution measured using refractive index, GC and the novel sensor. Flux influence: 3%.
Results. For Test A, the initial wash bath concentration target was 12%. Fresh bath concentration readings were 12% and 13%, as indicated by the bath analysis and the novel sensor, respectively. As the flux concentration increased, the indicated wash bath concentration increased to 15%, as shown by both measurement methods. Note that the indicated concentration value for either measurement technique varied by approximately 1% at a flux load of 1.5%. In this experiment, the flux addition induced a maximum intrinsic error of 3% at a concentrated flux loading of 3%.
For Test B, five concentrations, each loaded with 3% flux by volume, were measured using GC, the novel sensor and refractive index. As expected, refractive index measurements increased exponentially as the cleaning agent concentration increased, greatly overstating the concentration. On average, GC understated the known concentration by 1%. The novel sensor measurements overstated concentration by a low of 0.77% (5.77% vs. 5%) to a high of 2.94% (22.94% vs. 20%).
For Stage 2, the novel sensor (inline) was installed in the wash pump discharge line of a spray-in-air batch cleaner. The process settings used for this test are detailed in Table 1.
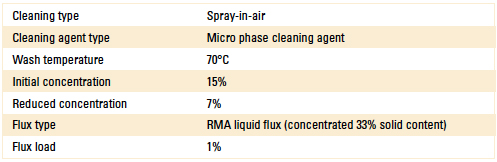
Table 1. Batch Cleaner Process Parameters
The wash tank was filled with fresh cleaning agent to an initial concentration of 15%, as verified by refractive index, bath analysis and the novel sensor. The cleaner basket remained empty, as this test was examining the effect of flux load on concentration measurement only. For this test, the liquid flux solid content was 33% and again concentrated through evaporation.
Following cycle start, flux was added, then diluted, and concentration re-measured employing refractive index and the bath analysis. The novel sensor continuously recorded wash bath concentration throughout the test.
Results. The initial wash bath concentration measured by refractive index and bath analysis was confirmed at 15% concentration.
Flux was added to a concentration of 1% by volume. During this wash cycle, the novel sensor measurements remained fairly constant throughout (Figure 11). At time t2, the bath analysis measurement remained accurate, yet the refractive index measured 22% (actual 14%). The wash bath was then diluted with DI-water. The novel sensor measured 7% as also indicated by the bath analysis, yet the refractive index measured 15%.
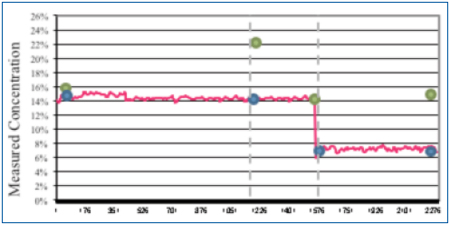
Figure 11. Concentration change analysis.
As expected, in the presence of flux residue, the refractive index reading overstated the wash bath concentration in both instances. At a 1% flux load, both the novel sensor and bath analysis very accurately indicated wash concentration, even as it was diluted by half.
Phase 3: Beta site test data. Based on the results of Phase 1 and 2 of the DoE, the authors proceeded with evaluating the novel sensor at a customer beta site. In this case, the customer had a qualified cleaning process for many years using an inline spray-in-air cleaner. Process parameters are detailed in Table 2.
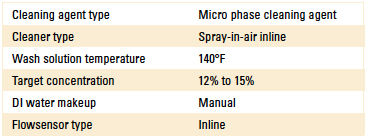
Table 2. Inline Cleaner Operating Parameters
Upon installing the sensor, a fresh wash bath was added and the concentration adjusted to the 12% target. As the customer monitored the concentration, DI-water was manually added using a dosing pump that was manually actuated as required. For this study, single point measurements were taken daily for four days following the initial startup using refractive index, the novel technique and novel sensor plotted in Figure 12.
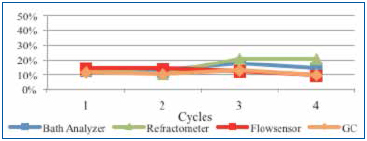
Figure 12. Beta site concentration readings.
The fresh wash bath concentration readings were very close between all measurement techniques at startup. However, as the production week progressed, concentrate and DI-water were added as required, as contaminants began to accumulate in the wash bath. Refractive index readings initially dropped and then increased, overstating concentration. The novel technique, GC and novel sensor measurements tracked consistently throughout the remainder of the week. Although this data stream is positive but limited, the customer is continuing to use and evaluate the measurement technology.
Conclusion
It is critical to determine the wash bath concentration, particularly as it becomes loaded with flux residue and other contaminants. Incorrect concentration measurements will lead to incorrect wash bath concentration adjustments. If the concentration is overstated, DI-water will be added, increasing dilution and potentially resulting in poor cleaning results and subsequently product reliability concerns. Alternatively, if the concentration is understated, concentrated cleaning agent will be added, increasing the wash bath concentration and the potential for material compatibility concerns.
The wash bath flux loading rate is certainly variable depending on the flux type used, solid content, board complexity, reflow profiles, and production volume to name a few. In this study, the flux analysis was limited to RMA. Rosin was shown to have a major impact on the accuracy of Refractive Index contributing to the overall inaccuracy of this measurement method. Alternatively, the rosin impact on the acoustic measurement device was minimal, thereby reducing its intrinsic measurement error.
GC can certainly be used for concentration measurement, even with contaminated samples. However, due to its cost and complexity, it is not feasible to use at the assembly plant level on an ongoing basis. The novel technique is a feasible alternative offering reasonable measurements – that is, within several percent of the target concentration as compared with GC analysis. This is a manual method and subject to human error.
Alternatively, the novel sensor as described herein, or the acoustic liquid flow measurement technique, is an inline device that continually and automatically monitors, records and displays the wash bath concentration in real time. Through the series of tests conducted and presented within this study with both fresh and RMA flux loaded cleaning agent, the authors have demonstrated that the novel sensor, once characterized for the specified cleaning agent and expected contaminants, accurately measures wash bath concentration in the presence of flux residue. For a wash bath solution loaded with 3% flux, the measurement overstated the target concentration in the range of 0.7% to 3%, depending on targeted concentration. The intrinsic error was less at a reduced flux load.
For this study, field data were limited yet consistent with the study test data and will continue to be collected.
Acknowledgments
Special thanks to Kester for providing the flux samples used for this study.
References
1. H.Wack, “Limitations of Refractive Index,” CIRCUITS ASSEMBLY, April 2009.
2. William T. Wright, “Managing Wash Lines and Controlling White Residue by Statistical Process Control,” Proceedings of SMTA International, September 2003.
Ed: This article was originally published in the proceedings of SMTA International, October 2013, and is reprinted here with permission of the authors.
Umut Tosun is an application technology manager, and Axel Vargas is a sales engineer at Zestron (zestron.com); umut.tosun@zestronusa.com. Bryan Kim, Ph.D., is director of engineering at Pressure Products (pressureproducts.com); bhkim@pressureproducts.com.


Press Releases
- Javad EMS Upgrades Through-Hole Soldering Capacity with New SEHO PowerWave System
- Sharpen Your Selective Soldering Skills with Kurtz Ersa's July VERSAFLOW 4/55 Training
- Omron Advances Inspection Technology with NVIDIA Omniverse and Metropolis
- Seika Machinery’s SMI 2026 Webinar Series Continues with Focus on PCB Cleaning Before Solder Paste Printing