

Capability and MSAs are Not the Same Thing
 One measures the variability of process outputs. The other assesses the tests themselves.
People often confuse measurement system analyses and capability studies. Far too often, I hear, “When will we run the capability study on the tester?” And while I’m sure those few brave souls who read my column do not fall into this trap, you might know of people who do. Maybe this column will help.
MSAs are for tests and gages. Capability studies are for the processes being measured. Or, to state it another way, MSAs give us confidence we can measure the capability of our process to produce parts to our customer’s specification.
One can talk about the “capability” of a tester, but only when the word is being used in its classic sense, for instance, “the extent of someone’s or something’s ability.” Let’s review.
Measurement system analysis. A measurement system is a collection of procedures, gages and operators used to obtain measurements. MSA is used to assess the ability of a measurement system using the following statistical metrics: stability, repeatability (test/retest variation) and reproducibility (operator variation).
The most common metric for an MSA is the gage R&R value. This value is a ratio of variation due to the measurement error (repeatability and reproducibility) to total variation of the system, including both part and measurement variation (FIGURE 1).
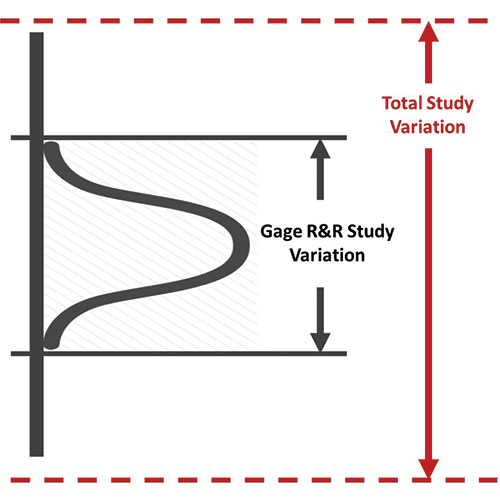
Figure 1. Gage R&R = Variation due to R and R / (Measurement + part variation).
Sometimes, one cannot find parts that demonstrate part variation to use in the MSA. An example is in electronics with electrical testing (in-circuit or functional testing). These systems make hundreds of measurements, and it is impractical to attempt to create or find part variation to use in the MSA. In these cases, we usually run the MSA with 10 or so parts off the line. In these cases, the part variation will be very low. Therefore, the gage R&R should be calculated as a percent of the tolerance spec range (FIGURE 2).
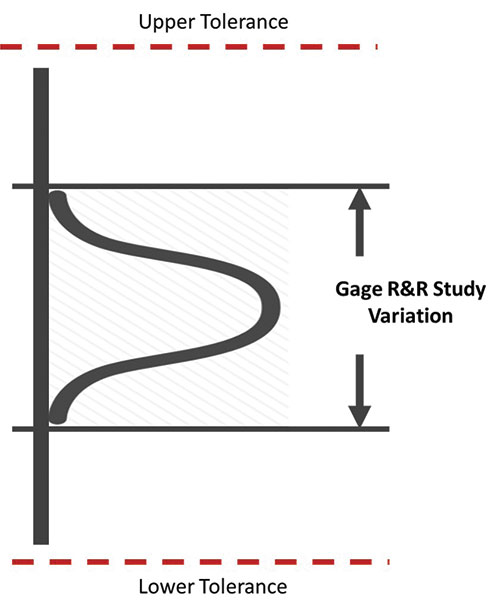
Figure 2. Gage R&R = Variation due to R and R / Tolerance range.
Capability analysis. From Wikipedia, “The process capability is a measurable property of a process to the specification, expressed as a process capability index (e.g., Cpk, Ppk, Cp, and/or Pp).” The output of this measurement is usually illustrated by a histogram and calculations that predict how many parts will be produced out of specification.
Two parts of process capability are: 1) measure the variability of the output of a process, and 2) compare that variability with a proposed specification or product tolerance (FIGURE 3).
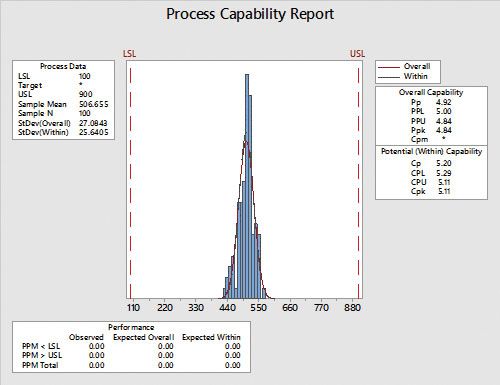
Figure 3. Cp (or Pp) = Spec range / (6 x total system variation (std dev)).
Capability studies assume the measurement variation is low enough to not be a factor, and the “total variation of the system” is effectively due to process and part variation.
Remember that to do a proper capability study we need a successful MSA, a stable process, and a large enough sample size to be statistically significant (usually about 90 pieces). Getting a good capability study from prototype builds is difficult due to the (usually) small sample size.
is a Six Sigma Master Black Belt with over 40 years’ experience in electronics manufacturing; john.borneman@gmail.com.


